Flex-Office-Warehouse
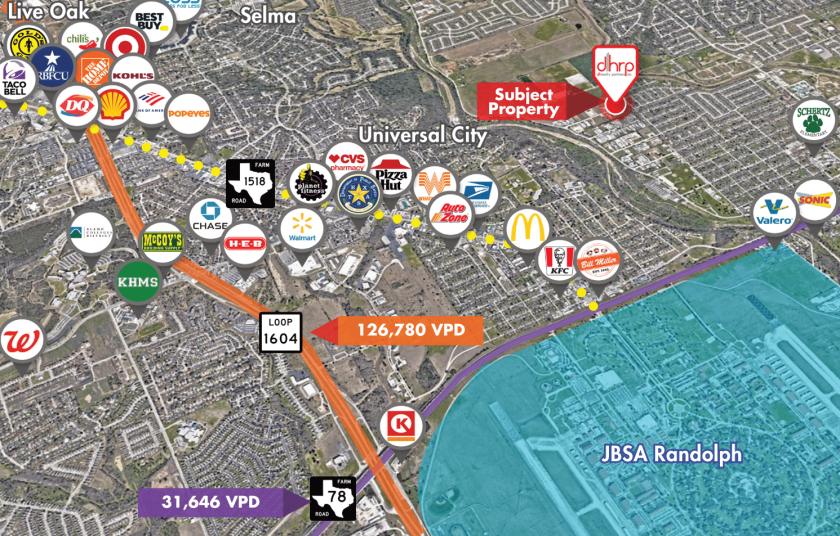
128 Windy Meadows Drive Schertz, TX 78154
128 Windy Meadows Drive Schertz, TX 78154

Details & Description
Property Highlights
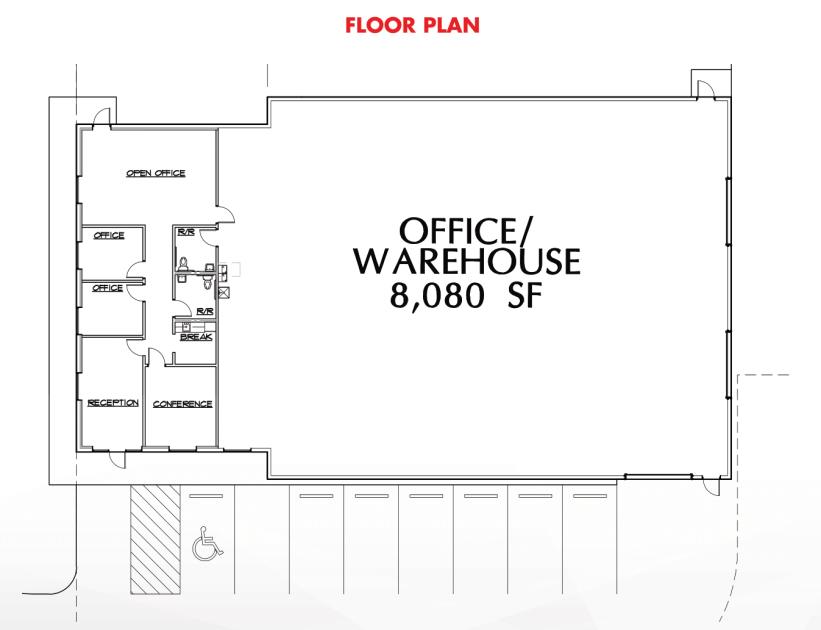
- • BRAND NEW construction office/warehouse
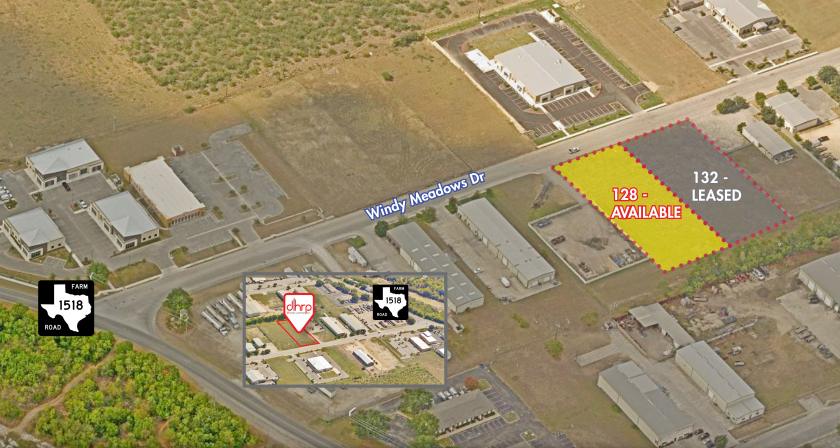
- • 1 acre lot
- • Located in the rapidly developing city of Schertz
- • In an area of new industrial/office development
Additional Photos


Listing Agents

Steves Rosser
O: 210-524-4000
M: 210-710-6460
srosser@reocsanantonio.com
O: 210-524-4000
M: 210-710-6460
srosser@reocsanantonio.com
While we strive to provide the most accurate information, all listing information, and demographic data, is provided by third-parties. As such, MyEListing will not be responsible for the accuracy of the information. It is strongly recommended that you verify all information with the listing agent, and any relevant agencies, prior to making any decisions.