Retail Space
1011 North Loop 1604 East San Antonio, TX 78258
1011 North Loop 1604 East San Antonio, TX 78258

Details & Description
Property Highlights
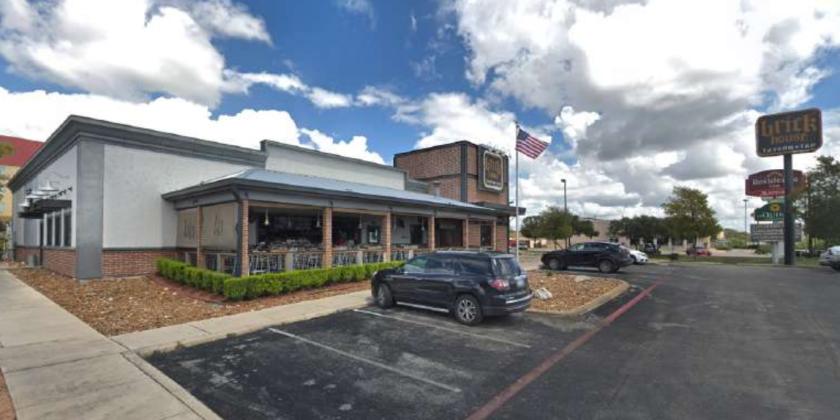
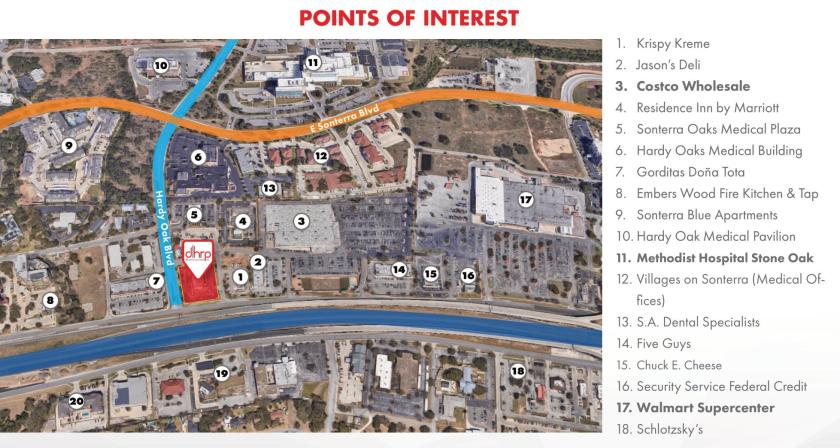
- • PRIME location with excellent visibility
- • Easy access to and from Loop 1604 and Hwy 281
- • Surrounded by highly trafficked medical buildings
Additional Photos


Listing Agents

Morgan Diaz
O: 210-222-2424
M: 210-836-8990
morgan@dhrp.us
O: 210-222-2424
M: 210-836-8990
morgan@dhrp.us
While we strive to provide the most accurate information, all listing information, and demographic data, is provided by third-parties. As such, MyEListing will not be responsible for the accuracy of the information. It is strongly recommended that you verify all information with the listing agent, and any relevant agencies, prior to making any decisions.


