Specialty Real Estate
231 County Road 173 Melrose, MN 56352
231 County Road 173 Melrose, MN 56352

Details & Description
Property Highlights
- • Year Built 1983
- • Price per Room: $36,000
- • ADR: $92.76 - STR - Trailing 12 months
- • REV PAR: $36.88
- • GRM: 2.93 XLs - 3 year average
- • 2022 Revenue: $322,500
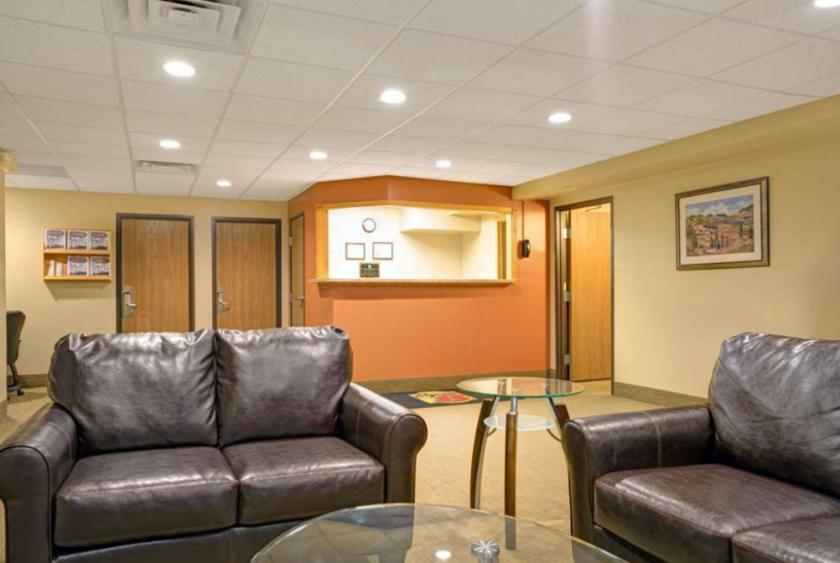
Additional Photos


Listing Agents

Dale Zomer
O: 605-444-7117
M: 605-351-1218
dzomer@naisiouxfalls.com
O: 605-444-7117
M: 605-351-1218
dzomer@naisiouxfalls.com
While we strive to provide the most accurate information, all listing information, and demographic data, is provided by third-parties. As such, MyEListing will not be responsible for the accuracy of the information. It is strongly recommended that you verify all information with the listing agent, and any relevant agencies, prior to making any decisions.