Retail Space
9470 West Northern Avenue Glendale, AZ 85305
9470 West Northern Avenue Glendale, AZ 85305

Details & Description
Property Highlights
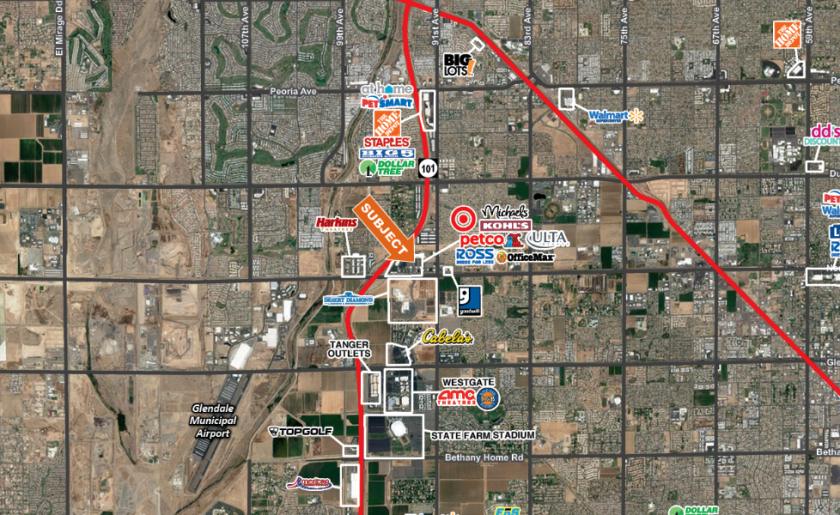
• Dense infill trade area with over 26,546 employees and 95,370 residents within a 3-mile radius
• Excellent access and exposure to the Loop 101 Agua Fria Fwy. 1/4 mile to the West
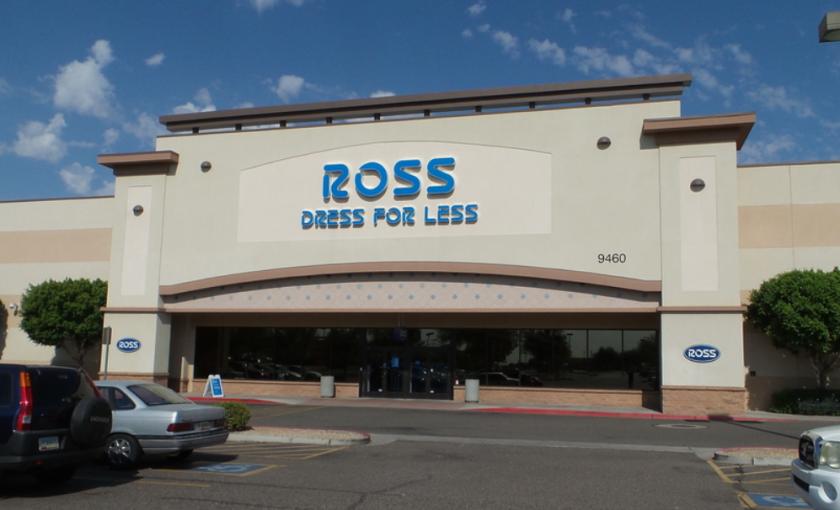
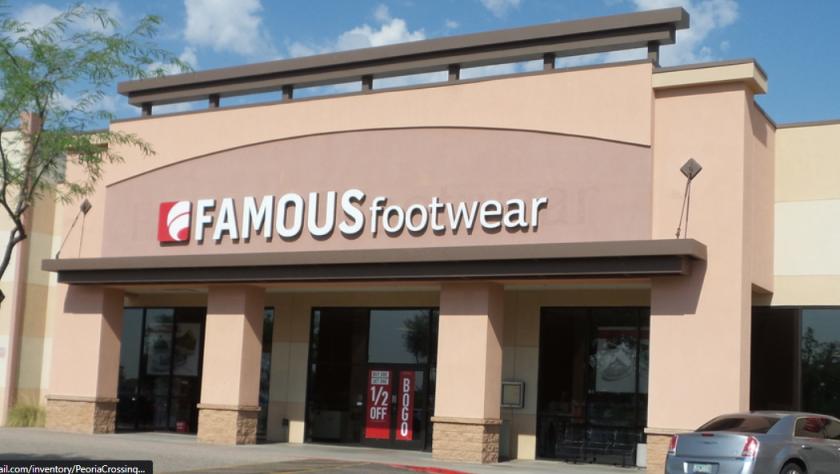
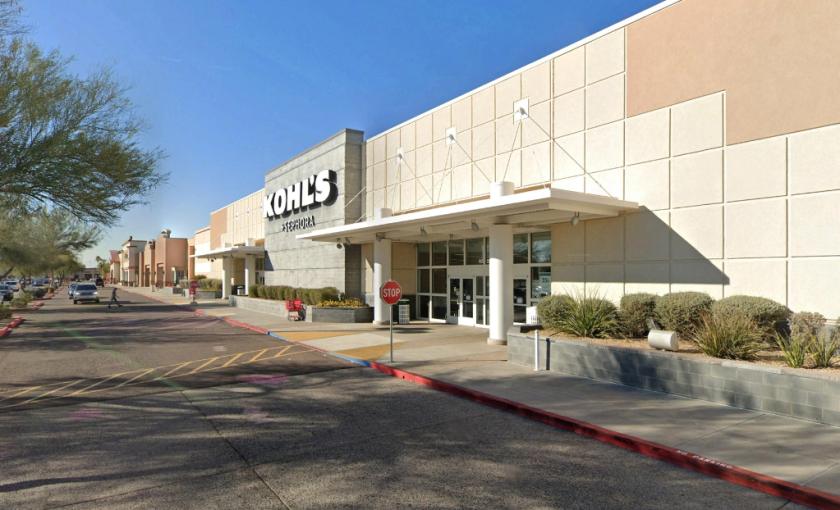
Additional Photos

Listing Agents

Katie Weeks
O: 602-368-1372
kweeks@w-retail.com
O: 602-368-1372
kweeks@w-retail.com

Bryan Ledbetter
O: 602-795-8670
bledbetter@w-retail.com
O: 602-795-8670
bledbetter@w-retail.com

Ryan Desmond
O: 602-931-4489
rdesmond@w-retail.com
O: 602-931-4489
rdesmond@w-retail.com
While we strive to provide the most accurate information, all listing information, and demographic data, is provided by third-parties. As such, MyEListing will not be responsible for the accuracy of the information. It is strongly recommended that you verify all information with the listing agent, and any relevant agencies, prior to making any decisions.