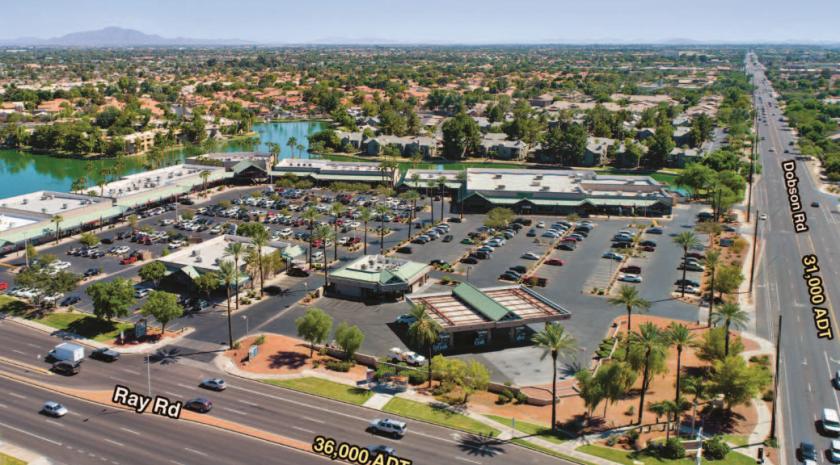
1-Mile | 3-Miles | 5-Miles | ||
---|---|---|---|---|
Total Population | 16,240 | 133,971 | 307,584 | |
Population Median Age | 37 | 36 | 37 | |
Population by Age | 0-9 Yrs | 2027 (12%) | 17086 (12%) | 36826 (11%) |
10-19 Yrs | 2049 (12%) | 16724 (12%) | 37549 (12%) | |
20-29 Yrs | 1970 (12%) | 20728 (15%) | 46222 (15%) | |
30-39 Yrs | 3024 (18%) | 22905 (17%) | 49172 (15%) | |
40-49 Yrs | 2198 (13%) | 17053 (12%) | 41017 (13%) | |
50-59 Yrs | 1969 (12%) | 17683 (13%) | 40990 (13%) | |
60-69 Yrs | 1759 (10%) | 12886 (9%) | 32437 (10%) | |
70+ Yrs | 1245 (7%) | 8906 (6%) | 23371 (7%) | |
Median HH Income | $77,105 | $73,975 | $82,164 | |
Total Household Income | < 24K | 610 (9%) | 5982 (11%) | 11985 (10%) |
25-49K | 1073 (17%) | 9834 (19%) | 20104 (17%) | |
50-74K | 1294 (21%) | 9773 (19%) | 21267 (18%) | |
75-99K | 960 (15%) | 7552 (15%) | 17141 (14%) | |
100-199K | 1734 (28%) | 13514 (26%) | 35345 (30%) | |
200K+ | 445 (7%) | 3672 (7%) | 10696 (9%) | |
Highest Education Level | No Diploma | 703 | 7780 | 13310 |
Diploma or GED | 2229 | 18378 | 36967 | |
Some College | 2436 | 20650 | 48841 | |
Assoc. Degree | 1089 | 9244 | 21172 | |
Bachelors Degree | 3316 | 23465 | 58353 | |
Higher Degree | 1767 | 12506 | 35000 | |
Total Housing Units | 6,431 | 53,369 | 123,654 | |
--Owner-Occupied | 3,664 | 28,483 | 72,153 | |
--Renter-Occupied | 2,451 | 21,844 | 44,385 | |
Owner-Occupied Values | < 100K | 37 | 1416 | 2642 |
100-199K | 474 | 4169 | 8144 | |
200-299K | 1642 | 11605 | 25748 | |
300-399K | 894 | 5852 | 20323 | |
400-499K | 302 | 2593 | 8418 | |
500K+ | 316 | 2848 | 6879 | |
Total Working Age Population | 12,858 | 106,509 | 247,301 | |
In Work Force | 9,095 | 77,902 | 178,307 | |
Not In Work Force | 3,763 | 28,607 | 68,993 | |
Workforce Employed | 8,681 | 74,371 | 170,195 | |
Workforce Unemployed | 414 | 3,516 | 8,052 | |
Civlian Workforce | 9,095 | 77,887 | 178,247 | |
Military Workforce | 0 | 15 | 61 | |
Total Households | 6,115 | 50,327 | 116,539 | |
Family Households | 3,916 | 32,397 | 75,948 | |
Non-Family Households | 2,199 | 17,930 | 40,591 | |
Married Couple | 2,807 | 22,292 | 56,006 | |
Other Family | 1,109 | 10,105 | 19,942 | |
Married w/Child | 1,178 | 9,277 | 22,816 | |
Single Male w/Child | 328 | 1,453 | 2,976 | |
Single Female w/Child | 351 | 4,017 | 7,166 |
Population Change Last Two Decades - Plus Projection
2000 | % | 2010 | % | 2020 | % | 2030 | |
---|---|---|---|---|---|---|---|
Arizona | 5,130,632 | +25 | 6,392,017 | +14 | 7,286,100 | +14 | 8,284,900 |
Maricopa County | 3,072,149 | +24 | 3,817,117 | +16 | 4,436,900 | +15 | 5,107,700 |
Total Working Age Population:
Total Households:
Total Working Age Population:
Total Households:
Total Working Age Population:
Total Households: