Commercial Land
10745 East Main Street Mesa, AZ 85208
10745 East Main Street Mesa, AZ 85208
Details & Description
Property Highlights
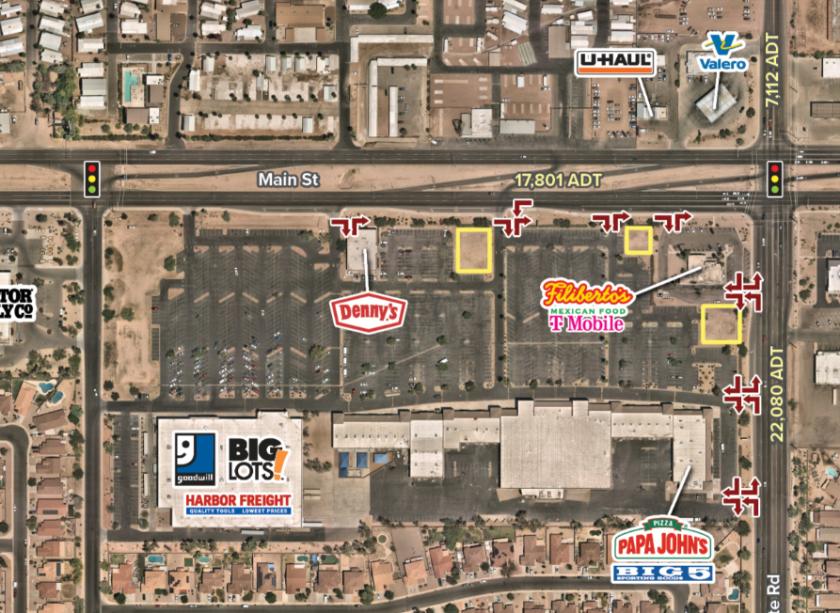
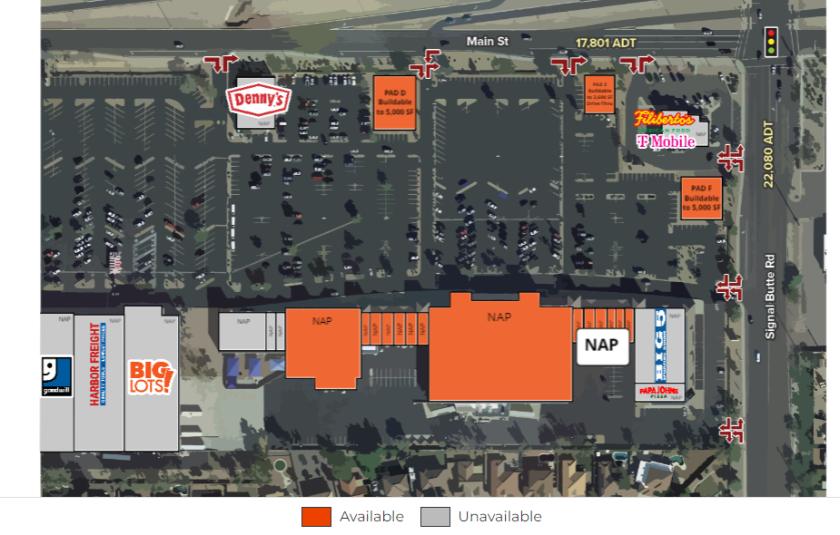
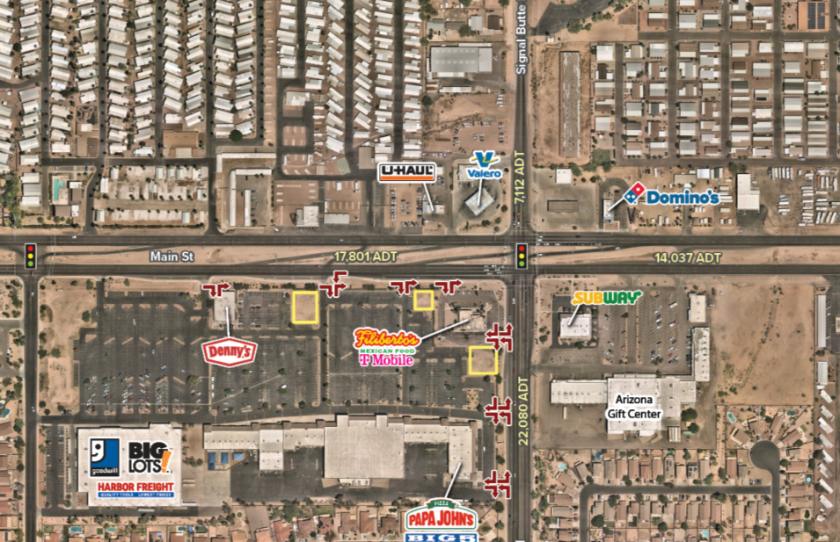
- • Retail PADS off Apache Trail
- • PAD D - 41,556 SF - Buildable to 5,000 SF
- • PAD F - 46,454 SF - Buildable to 5,000 SF
- • For Sale Build to Suit or Ground Lease
Additional Photos
Listing Agents

Jason Fessinger
O: 602-368-1090
jfessinger@w-retail.com
O: 602-368-1090
jfessinger@w-retail.com

Kalen Rickard
O: 602-931-4492
krickard@w-retail.com
O: 602-931-4492
krickard@w-retail.com

Julie Green
Western Retail Advisors
O: 602-710-1786
jgreen@w-retail.com
Western Retail Advisors
O: 602-710-1786
jgreen@w-retail.com
While we strive to provide the most accurate information, all listing information, and demographic data, is provided by third-parties. As such, MyEListing will not be responsible for the accuracy of the information. It is strongly recommended that you verify all information with the listing agent, and any relevant agencies, prior to making any decisions.


