Retail Space
3251 Highland Avenue Cincinnati, OH 45213
3251 Highland Avenue Cincinnati, OH 45213

Details & Description
Property Highlights
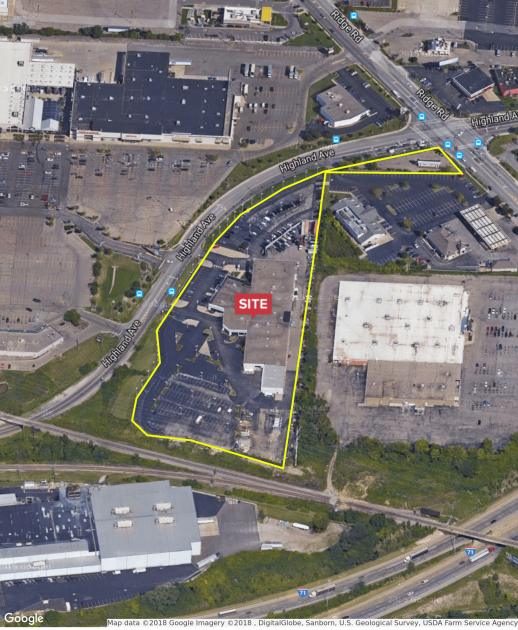
- • 7.35 Acres at Ridge Rd. & Highland Ave
- • 54,654 sf. Showroom/Office + Service/Warehouse
- • Parking for over 570 Cars
- • 6,000 sf. Mezzanine/Storage
- • Direct access to I-71 North & South
Additional Photos


Listing Agents

Billy Gillman
O: 513-322-6319
M: 513-604-4530
billy@bergmancommercial.com
O: 513-322-6319
M: 513-604-4530
billy@bergmancommercial.com
While we strive to provide the most accurate information, all listing information, and demographic data, is provided by third-parties. As such, MyEListing will not be responsible for the accuracy of the information. It is strongly recommended that you verify all information with the listing agent, and any relevant agencies, prior to making any decisions.


