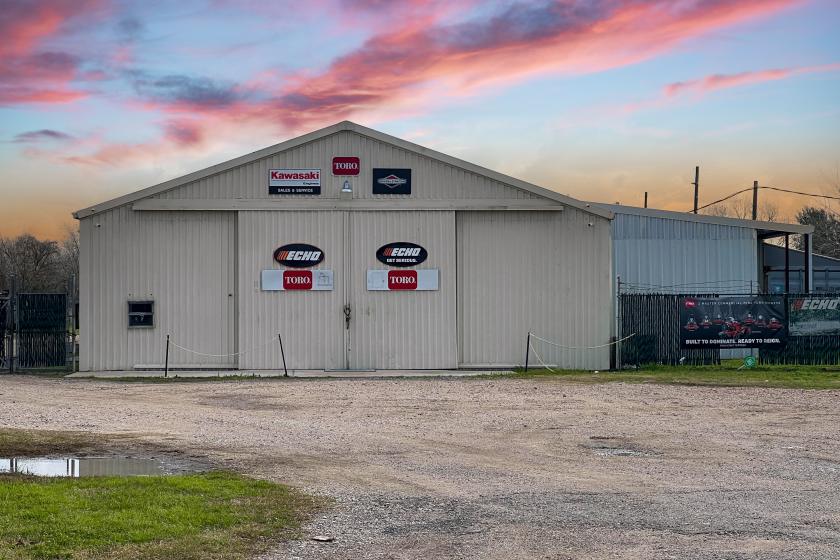
6938 FM 362 Rd. is a 3,180+ sf metal warehouse (seller additions bring approximate size to +/- 4,000 SF) building sitting on +/- 1.54 acres of cleared and fully fenced land at the burgeoning intersection of FM 362 and FM 529 in the Brookshire / Pattison area of Waller County. The property features 164? of frontage along FM 362 just south of the lighted intersection.
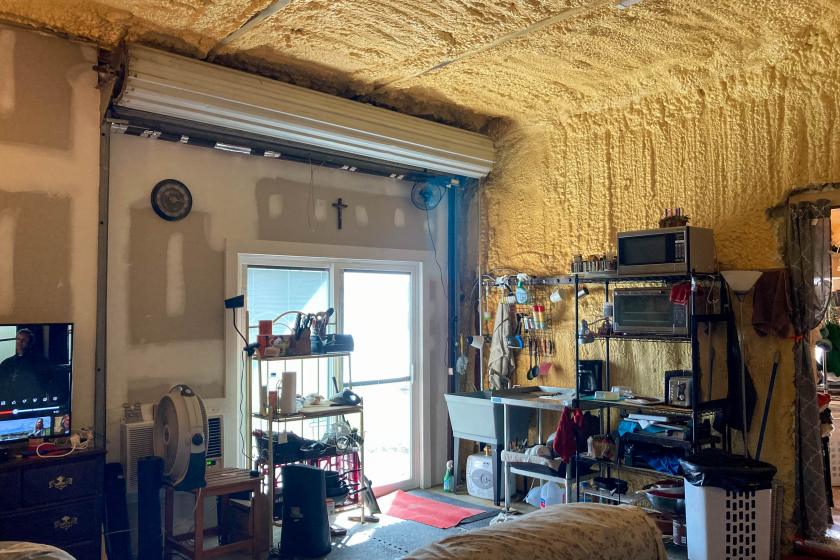
The building features a sliding security door that protects the front glass, 3 phase power, and a 5 ton overhead crane. It is currently configured as roughly half finished and air conditioned showroom, half non-conditioned warehouse space. In addition there is a conditioned storage area that is currently being used as living quarters and a large carport area.
6938 FM 362 is NOT on well and septic, enjoying those services from Rose Hill MUD. It is located in a FEMA Zone X, outside of any high risk floodplains or floodways. In addition, a billboard lease produces $300/month rental income to the property owners.
The owners have confirmed with their lender that their note, currently at 4.5%, is assumable, making financing at better than current market rates possible. Contact us for more details.
The owners also own McCouls Lawn Care, a landscaping supply and repair company that they are currently running out of this building. Because there is an active business at the location, the Sellers will require a minimum three month temporary leaseback to vacate. The business is available for sale at an additional cost – and any interested parties will be connected with the Sellers to discuss directly. The listing agent for this property is listing the real estate only.
No part of this information may be copied, reproduced, repurposed, or screen-captured for any commercial purpose without prior written authorization from MyEListing.
While we strive to provide the most accurate information, all listing information, and demographic data, is provided by third-parties. As such, MyEListing will not be responsible for the accuracy of the information. It is strongly recommended that you verify all information with the listing agent, and any relevant agencies, prior to making any decisions.
What is the asking price for 6938 Farm to Market 362 in Waller?
The asking price for 6938 Farm to Market 362 is $1,100,000
What is the building size of this Industrial property in Waller, TX?
The size of the building/unit at 6938 Farm to Market 362 in Waller is 4,000 square feet
How much land does the Waller, TX property at 6938 Farm to Market 362 include?
6938 Farm to Market 362 in Waller includes 1.540 acres of land
What kind of Industrial is the propery at 6938 Farm to Market 362?
The property at 6938 Farm to Market 362 Waller, TX 77484 is listed as a Warehouse Industrial property
What is the population within 1 mile of 6938 Farm to Market 362 in Waller?
The population within 1 mile of 6938 Farm to Market 362 Waller, TX 77484 is 83 people.
Who do I contact for questions about 6938 Farm to Market 362?
You should contact the listing agent,
Brian Varvel, for any details regarding this commercial listing.