Retail Space
4404 E Oaks St Phoenix, AZ 85008
4404 E Oaks St Phoenix, AZ 85008

Details & Description
Property Highlights
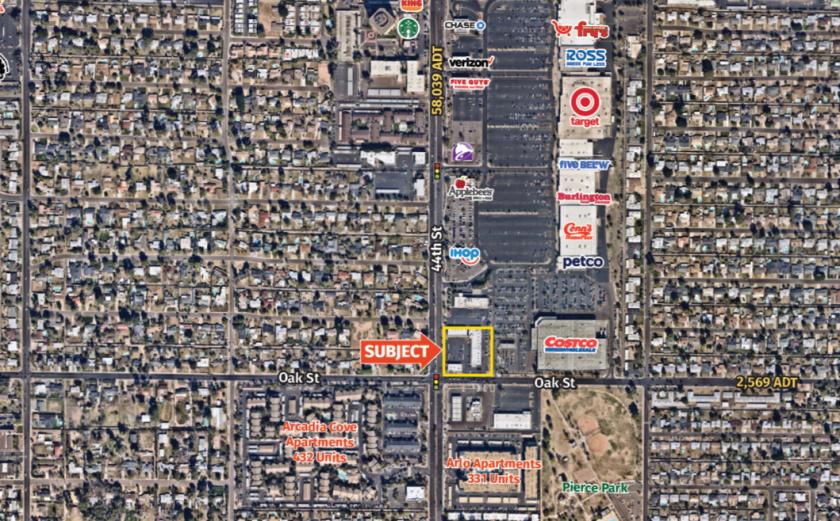
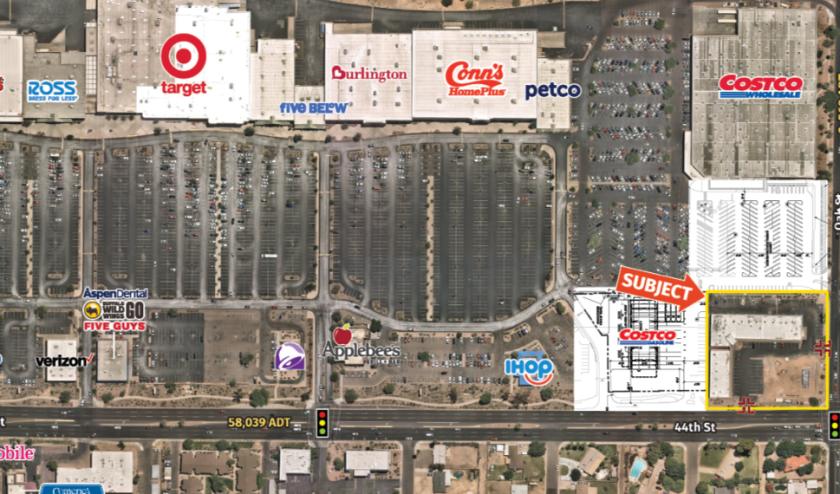
• Unobstructed Views on 44th Street in front of Costco, Target, Fry’s and Ross
• 1,000 SF & 1,200 SF inline shop space available
Additional Photos

Listing Agents

Jason Fessinger
O: 602-368-1090
jfessinger@w-retail.com
O: 602-368-1090
jfessinger@w-retail.com

Kalen Rickard
O: 602-931-4492
krickard@w-retail.com
O: 602-931-4492
krickard@w-retail.com

Julie Green
Western Retail Advisors
O: 602-710-1786
jgreen@w-retail.com
Western Retail Advisors
O: 602-710-1786
jgreen@w-retail.com
While we strive to provide the most accurate information, all listing information, and demographic data, is provided by third-parties. As such, MyEListing will not be responsible for the accuracy of the information. It is strongly recommended that you verify all information with the listing agent, and any relevant agencies, prior to making any decisions.


