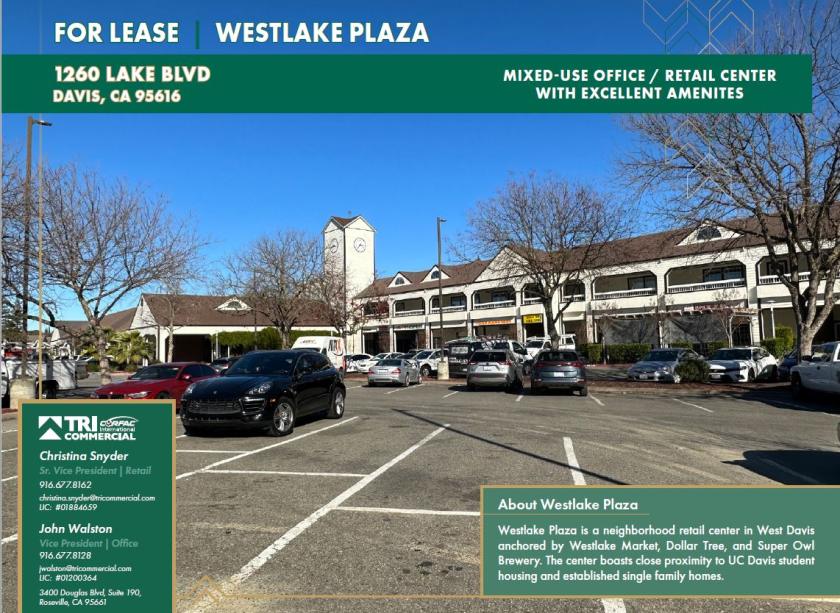
1-Mile | 3-Miles | 5-Miles | ||
---|---|---|---|---|
Total Population | 11,734 | 51,345 | 76,437 | |
Population Median Age | 36 | 32 | 33 | |
Population by Age | 0-9 Yrs | 788 (6%) | 2297 (4%) | 4871 (6%) |
10-19 Yrs | 1268 (10%) | 11010 (21%) | 14851 (19%) | |
20-29 Yrs | 4655 (39%) | 20664 (40%) | 26934 (35%) | |
30-39 Yrs | 899 (7%) | 3704 (7%) | 6399 (8%) | |
40-49 Yrs | 834 (7%) | 2949 (5%) | 5743 (7%) | |
50-59 Yrs | 891 (7%) | 3212 (6%) | 6165 (8%) | |
60-69 Yrs | 1116 (9%) | 3511 (6%) | 5492 (7%) | |
70+ Yrs | 1284 (10%) | 3997 (7%) | 5983 (7%) | |
Median HH Income | $78,160 | $60,035 | $68,760 | |
Total Household Income | < 24K | 881 (20%) | 4905 (28%) | 6413 (24%) |
25-49K | 673 (15%) | 2433 (14%) | 3579 (13%) | |
50-74K | 568 (13%) | 2564 (14%) | 3670 (14%) | |
75-99K | 394 (9%) | 1413 (8%) | 2334 (9%) | |
100-199K | 1146 (26%) | 3880 (22%) | 6225 (24%) | |
200K+ | 682 (15%) | 1939 (11%) | 3576 (13%) | |
Highest Education Level | No Diploma | 117 | 426 | 1079 |
Diploma or GED | 349 | 1302 | 2675 | |
Some College | 539 | 2750 | 4192 | |
Assoc. Degree | 228 | 1044 | 1616 | |
Bachelors Degree | 2112 | 6955 | 11365 | |
Higher Degree | 2756 | 9315 | 14872 | |
Total Housing Units | 4,645 | 18,276 | 27,440 | |
--Owner-Occupied | 1,952 | 6,093 | 10,691 | |
--Renter-Occupied | 2,392 | 11,042 | 15,105 | |
Owner-Occupied Values | < 100K | 15 | 102 | 180 |
100-199K | 0 | 30 | 114 | |
200-299K | 90 | 143 | 411 | |
300-399K | 160 | 348 | 559 | |
400-499K | 197 | 385 | 724 | |
500K+ | 1490 | 5085 | 8704 | |
Total Working Age Population | 10,483 | 47,079 | 67,702 | |
In Work Force | 6,220 | 23,765 | 35,782 | |
Not In Work Force | 4,263 | 23,313 | 31,921 | |
Workforce Employed | 5,749 | 21,795 | 33,192 | |
Workforce Unemployed | 463 | 1,903 | 2,505 | |
Civlian Workforce | 6,212 | 23,698 | 35,697 | |
Military Workforce | 8 | 67 | 85 | |
Total Households | 4,343 | 17,135 | 25,797 | |
Family Households | 2,117 | 7,335 | 12,634 | |
Non-Family Households | 2,226 | 9,799 | 13,162 | |
Married Couple | 1,801 | 6,116 | 10,254 | |
Other Family | 316 | 1,219 | 2,380 | |
Married w/Child | 701 | 2,241 | 4,252 | |
Single Male w/Child | 31 | 150 | 256 | |
Single Female w/Child | 90 | 365 | 851 |
Population Change Last Two Decades - Plus Projection
2000 | % | 2010 | % | 2020 | % | 2030 | |
---|---|---|---|---|---|---|---|
California | 33,871,648 | +10 | 37,253,956 | +9 | 40,467,295 | +8 | 43,631,295 |
Solano County | 394,542 | +5 | 413,344 | +9 | 449,432 | +11 | 499,633 |
Yolo County | 168,660 | +19 | 200,849 | +13 | 227,595 | +14 | 259,339 |
Total Working Age Population:
Total Households:
Total Working Age Population:
Total Households:
Total Working Age Population:
Total Households: