Retail Space
1334 East Chandler Boulevard Phoenix, AZ 85048
1334 East Chandler Boulevard Phoenix, AZ 85048

Details & Description
Property Highlights
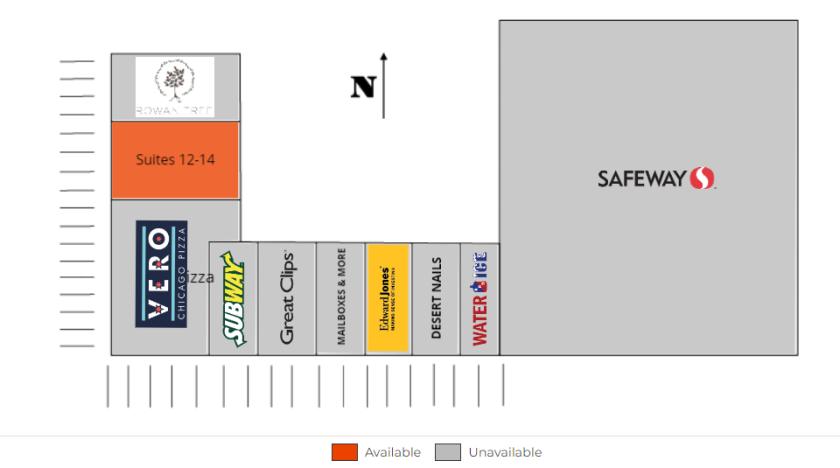
- • Suites 12-14 Space Available 1,200 - 2,300 SF
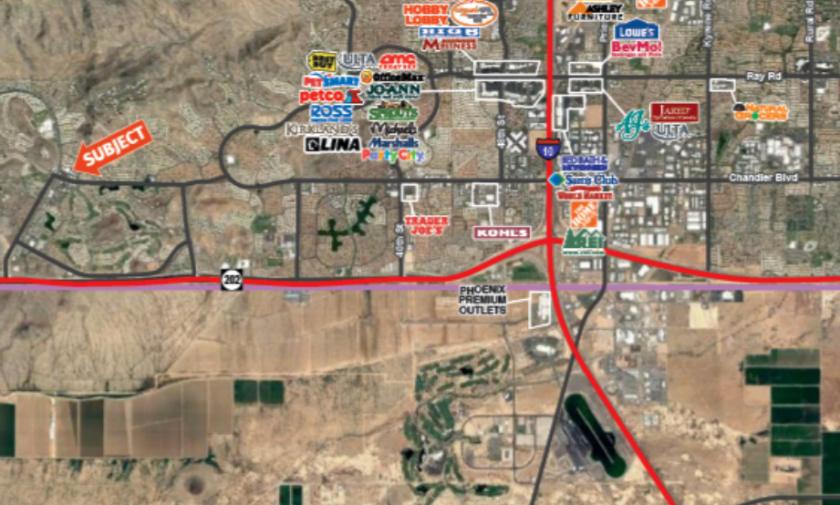
- • High Daily Traffic Counts Along Chandler Blvd.
- • Ample & Convenient Parking
Additional Photos

Listing Agents

Duane Solomon
Western Retail Advisors
M: 602-778-3747
dsolomon@w-retail.com
Western Retail Advisors
M: 602-778-3747
dsolomon@w-retail.com
While we strive to provide the most accurate information, all listing information, and demographic data, is provided by third-parties. As such, MyEListing will not be responsible for the accuracy of the information. It is strongly recommended that you verify all information with the listing agent, and any relevant agencies, prior to making any decisions.


