Retail Space
1709 - 1743 E Broadway Rd Tempe, AZ 85281
1709 - 1743 E Broadway Rd Tempe, AZ 85281

Details & Description
Property Highlights
- • LAST SPACE AVAILABLE 1,260 SF
- • Complimentary tenant mix
- • $82,000+ Average Household Income in 5-Mile Radius
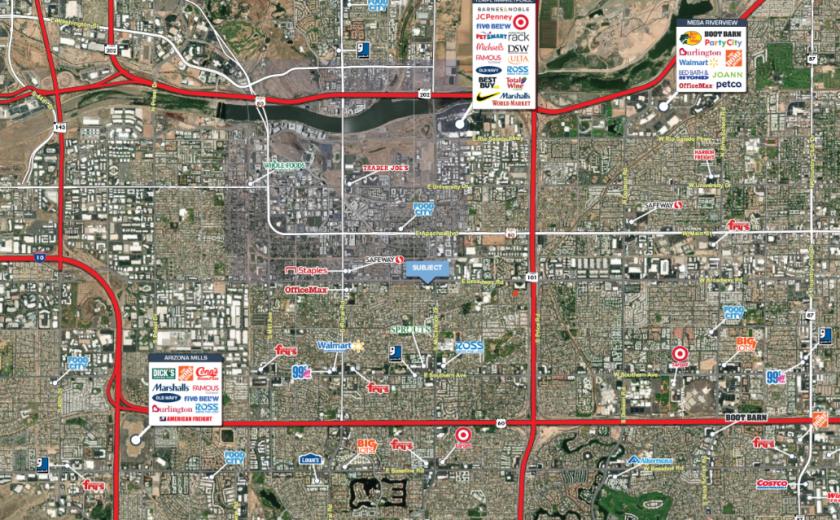
- • SWC Broadway & McClintock, Tempe
- • Over 60,000 cars per day at intersection
- • 1.5 miles from ASU which has over 53,000 students
Additional Photos


Listing Agents

Jason Fessinger
O: 602-368-1090
jfessinger@w-retail.com
O: 602-368-1090
jfessinger@w-retail.com

Kalen Rickard
O: 602-931-4492
krickard@w-retail.com
O: 602-931-4492
krickard@w-retail.com

Julie Green
Western Retail Advisors
O: 602-710-1786
jgreen@w-retail.com
Western Retail Advisors
O: 602-710-1786
jgreen@w-retail.com
While we strive to provide the most accurate information, all listing information, and demographic data, is provided by third-parties. As such, MyEListing will not be responsible for the accuracy of the information. It is strongly recommended that you verify all information with the listing agent, and any relevant agencies, prior to making any decisions.


