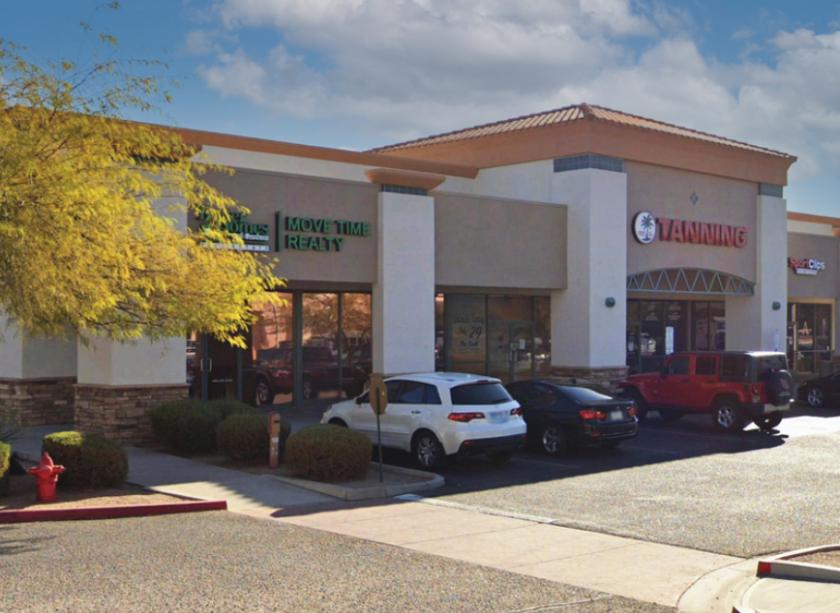
Retail Space
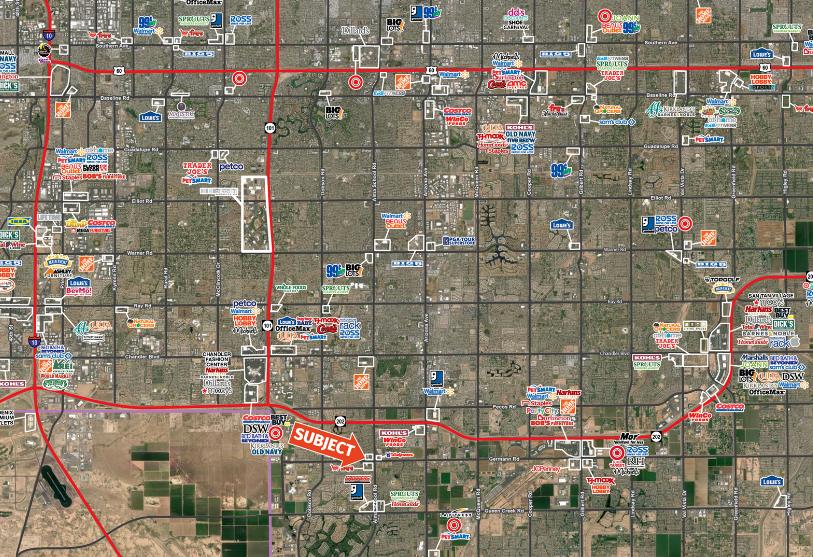
1860 South Alma School Road Chandler, AZ 85286
1860 South Alma School Road Chandler, AZ 85286
Details & Description
Property Highlights
• Previously real estate office with 6 private offices, large break room and reception area.
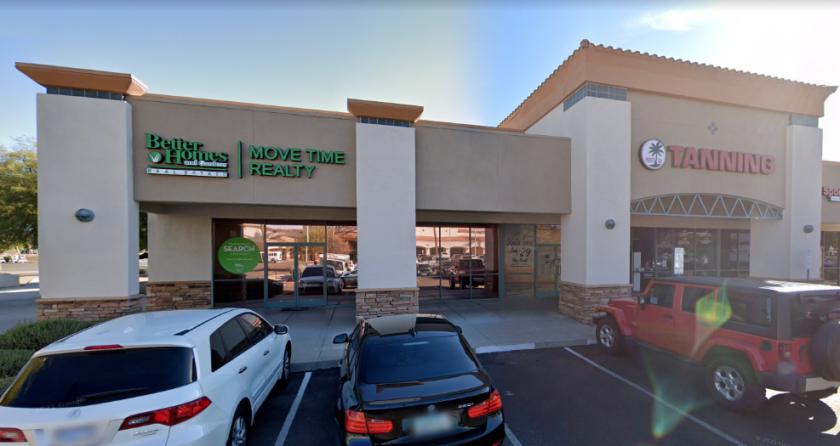
• End Cap located near the entrance to the center - Approximately 38 feet of frontage.
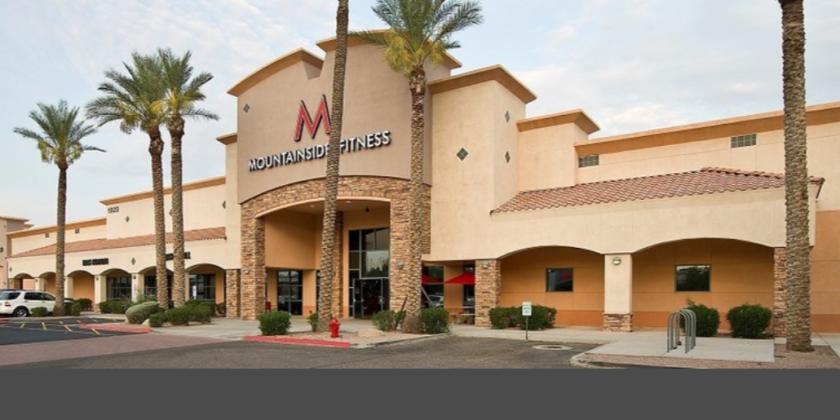
Additional Photos

Listing Agents

Bryan Ledbetter
O: 602-795-8670
bledbetter@w-retail.com
O: 602-795-8670
bledbetter@w-retail.com

Katie Weeks
O: 602-368-1372
kweeks@w-retail.com
O: 602-368-1372
kweeks@w-retail.com
While we strive to provide the most accurate information, all listing information, and demographic data, is provided by third-parties. As such, MyEListing will not be responsible for the accuracy of the information. It is strongly recommended that you verify all information with the listing agent, and any relevant agencies, prior to making any decisions.


