Retail Space
1721 West Warner Road Tempe, AZ 85284
1721 West Warner Road Tempe, AZ 85284
Details & Description
Property Highlights
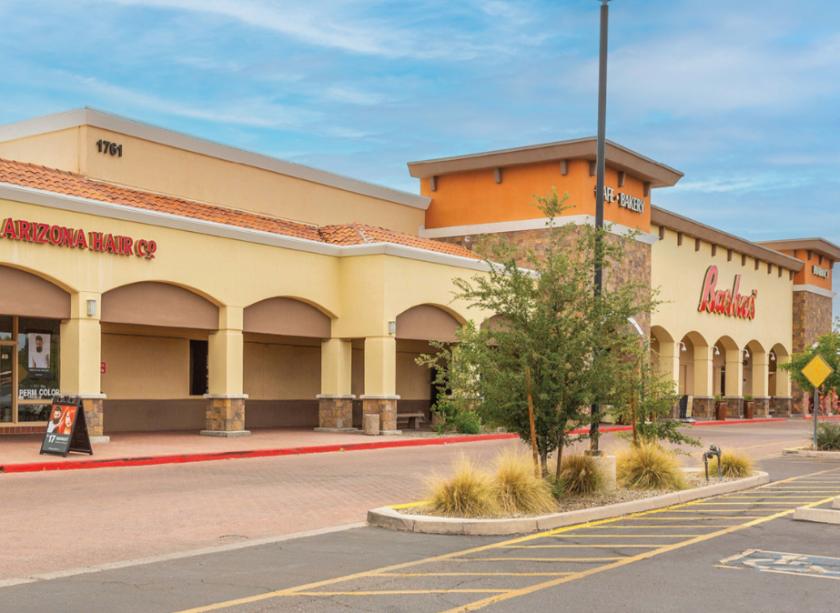
- • Grocery Anchored Neighborhood Shopping Center
- • ONE SPACE COMING AVAILABLE - 3,477 SF
- • Affluent, highly educated trade area
- • Well traveled intersection
Additional Photos


Listing Agents

Kalen Rickard
O: 602-931-4492
krickard@w-retail.com
O: 602-931-4492
krickard@w-retail.com

Jason Fessinger
O: 602-368-1090
jfessinger@w-retail.com
O: 602-368-1090
jfessinger@w-retail.com

Julie Green
Western Retail Advisors
O: 602-710-1786
jgreen@w-retail.com
Western Retail Advisors
O: 602-710-1786
jgreen@w-retail.com
While we strive to provide the most accurate information, all listing information, and demographic data, is provided by third-parties. As such, MyEListing will not be responsible for the accuracy of the information. It is strongly recommended that you verify all information with the listing agent, and any relevant agencies, prior to making any decisions.


