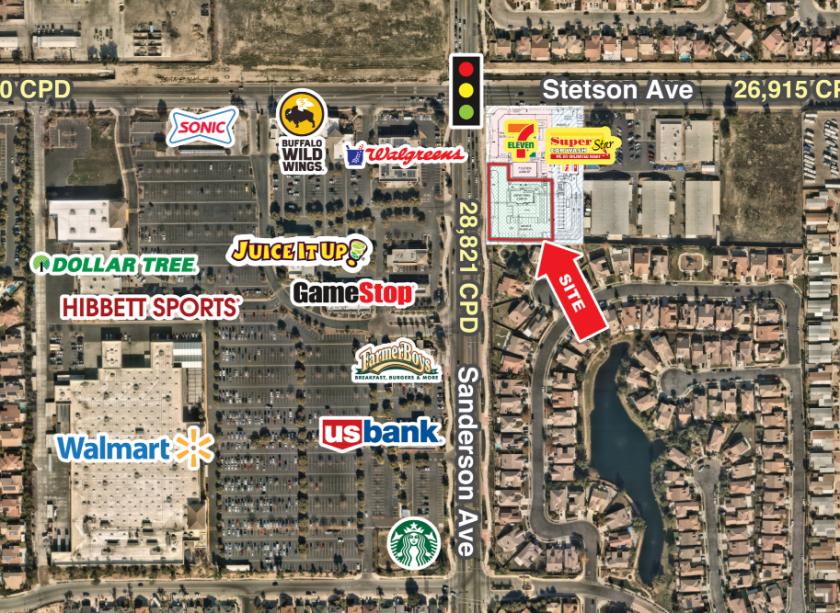
1-Mile | 3-Miles | 5-Miles | ||
---|---|---|---|---|
Total Population | 11,520 | 69,249 | 133,035 | |
Population Median Age | 40 | 40 | 38 | |
Population by Age | 0-9 Yrs | 1727 (14%) | 9537 (13%) | 18957 (14%) |
10-19 Yrs | 1613 (14%) | 9963 (14%) | 20507 (15%) | |
20-29 Yrs | 1411 (12%) | 8945 (12%) | 18494 (13%) | |
30-39 Yrs | 1065 (9%) | 7200 (10%) | 15367 (11%) | |
40-49 Yrs | 1245 (10%) | 6420 (9%) | 14064 (10%) | |
50-59 Yrs | 1019 (8%) | 7738 (11%) | 14947 (11%) | |
60-69 Yrs | 1396 (12%) | 7996 (11%) | 13790 (10%) | |
70+ Yrs | 2043 (17%) | 11449 (16%) | 16908 (12%) | |
Median HH Income | $53,328 | $42,349 | $46,745 | |
Total Household Income | < 24K | 799 (20%) | 6911 (29%) | 10962 (26%) |
25-49K | 1009 (26%) | 6536 (28%) | 11067 (26%) | |
50-74K | 882 (22%) | 4148 (17%) | 7699 (18%) | |
75-99K | 443 (11%) | 2265 (9%) | 4561 (10%) | |
100-199K | 661 (17%) | 2867 (12%) | 6019 (14%) | |
200K+ | 57 (1%) | 598 (2%) | 1172 (2%) | |
Highest Education Level | No Diploma | 1152 | 9465 | 17864 |
Diploma or GED | 2198 | 13931 | 25011 | |
Some College | 2086 | 12282 | 23450 | |
Assoc. Degree | 803 | 4137 | 7274 | |
Bachelors Degree | 739 | 3631 | 7379 | |
Higher Degree | 362 | 2120 | 3769 | |
Total Housing Units | 4,130 | 25,949 | 46,085 | |
--Owner-Occupied | 2,649 | 14,002 | 25,072 | |
--Renter-Occupied | 1,202 | 9,323 | 16,408 | |
Owner-Occupied Values | < 100K | 447 | 4351 | 5720 |
100-199K | 543 | 2901 | 4347 | |
200-299K | 1060 | 4029 | 8213 | |
300-399K | 564 | 2213 | 5223 | |
400-499K | 22 | 224 | 828 | |
500K+ | 12 | 283 | 741 | |
Total Working Age Population | 8,856 | 53,581 | 101,859 | |
In Work Force | 4,574 | 25,892 | 53,730 | |
Not In Work Force | 4,282 | 27,690 | 48,129 | |
Workforce Employed | 4,273 | 23,045 | 47,797 | |
Workforce Unemployed | 281 | 2,784 | 5,811 | |
Civlian Workforce | 4,554 | 25,829 | 53,608 | |
Military Workforce | 20 | 62 | 121 | |
Total Households | 3,851 | 23,325 | 41,480 | |
Family Households | 2,664 | 15,068 | 28,901 | |
Non-Family Households | 1,187 | 8,257 | 12,578 | |
Married Couple | 1,813 | 10,478 | 19,491 | |
Other Family | 851 | 4,590 | 9,411 | |
Married w/Child | 636 | 4,553 | 8,606 | |
Single Male w/Child | 213 | 767 | 1,265 | |
Single Female w/Child | 191 | 1,342 | 3,514 |
Population Change Last Two Decades - Plus Projection
2000 | % | 2010 | % | 2020 | % | 2030 | |
---|---|---|---|---|---|---|---|
California | 33,871,648 | +10 | 37,253,956 | +9 | 40,467,295 | +8 | 43,631,295 |
Riverside County | 1,545,387 | +42 | 2,189,641 | +14 | 2,493,116 | +14 | 2,843,493 |
Total Working Age Population:
Total Households:
Total Working Age Population:
Total Households:
Total Working Age Population:
Total Households: