Commercial Land
NEC 43rd Ave and Baseline Rd Phoenix, AZ 85042
NEC 43rd Ave and Baseline Rd Phoenix, AZ 85042

Details & Description
Property Highlights
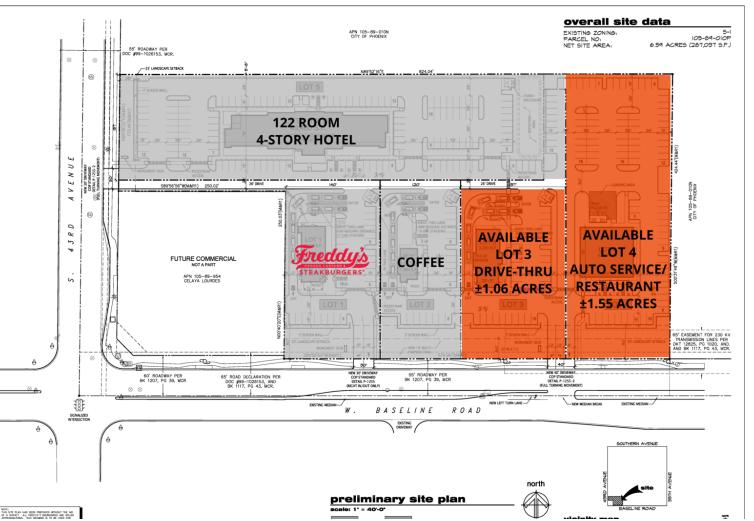
- • Drive-Thru Pads for Ground Lease
- • 122 Room Hotel Coming Soon
- • Signalized Intersection with over 41K VPD
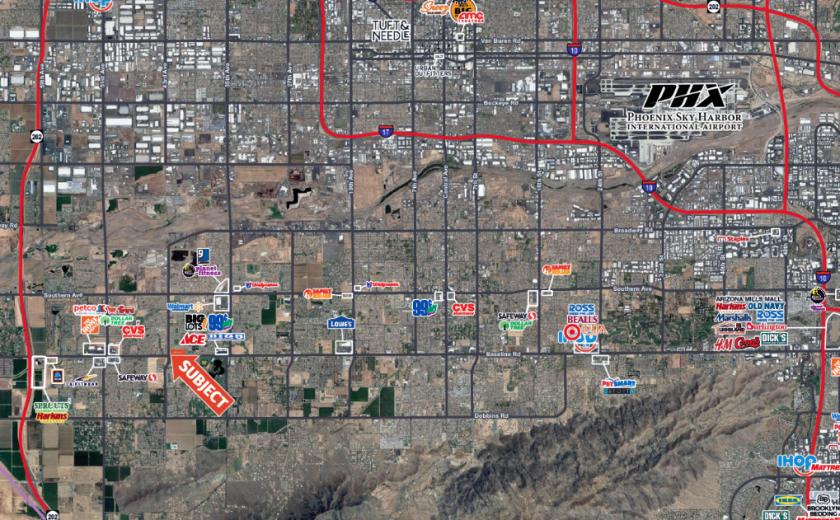
- • Strong housing growth in the trade area
- • ±2 miles east of the new Loop 202 Freeway
Listing Agents

Bryan Babits
O: 602-931-4491
bbabits@w-retail.com
O: 602-931-4491
bbabits@w-retail.com

Bryan Ledbetter
O: 602-795-8670
bledbetter@w-retail.com
O: 602-795-8670
bledbetter@w-retail.com

Justin DiBiase
O: 480-653-9212
jdibiase@w-retail.com
O: 480-653-9212
jdibiase@w-retail.com
While we strive to provide the most accurate information, all listing information, and demographic data, is provided by third-parties. As such, MyEListing will not be responsible for the accuracy of the information. It is strongly recommended that you verify all information with the listing agent, and any relevant agencies, prior to making any decisions.