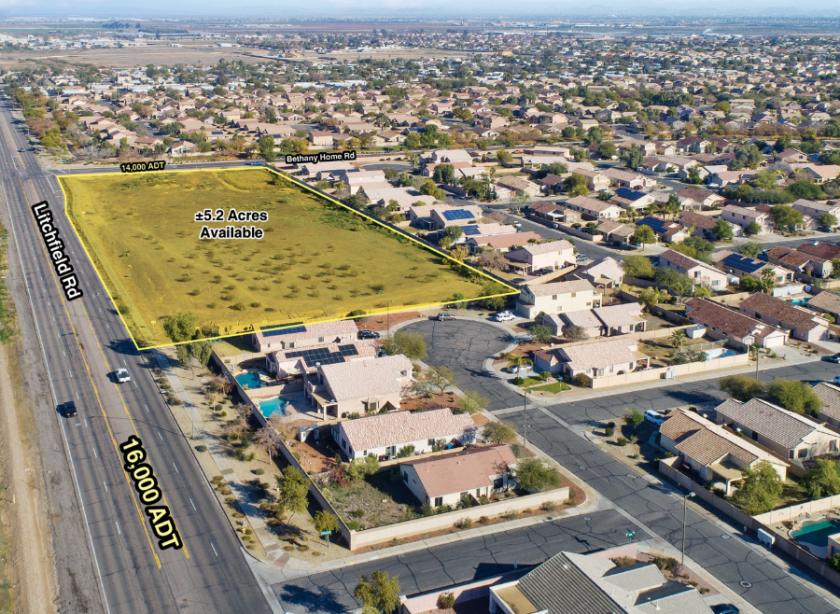
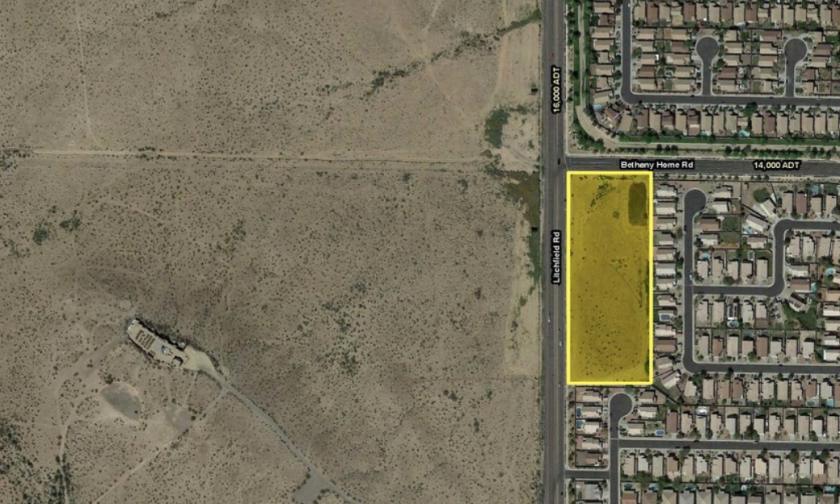
Commercial Land
SEC Bethany Home Rd and Litchfield Rd Litchfield Park, AZ 85340
SEC Bethany Home Rd and Litchfield Rd Litchfield Park, AZ 85340
Details & Description
Property Highlights
• Parcel(s): APN 501-62-012B
• Zoning: C-2 City of Goodyear
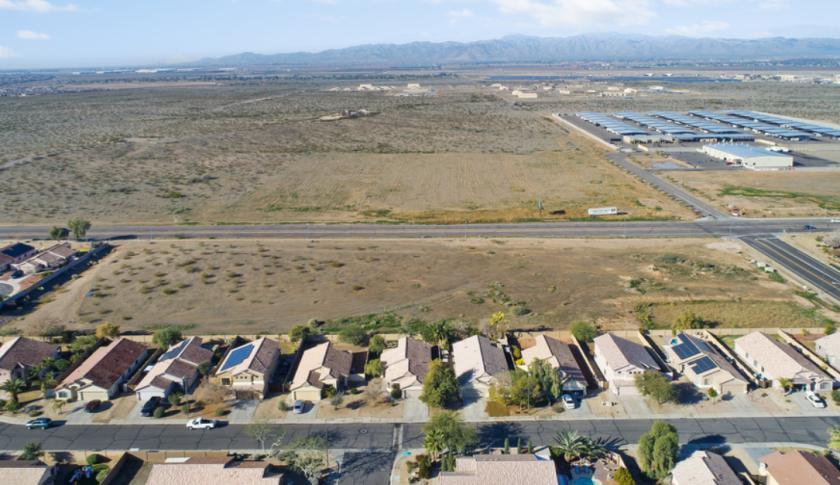
Additional Photos


Listing Agents

Brian Gausden
O: 602-778-3740
bgausden@w-retail.com
O: 602-778-3740
bgausden@w-retail.com
While we strive to provide the most accurate information, all listing information, and demographic data, is provided by third-parties. As such, MyEListing will not be responsible for the accuracy of the information. It is strongly recommended that you verify all information with the listing agent, and any relevant agencies, prior to making any decisions.


