Industrial Properties
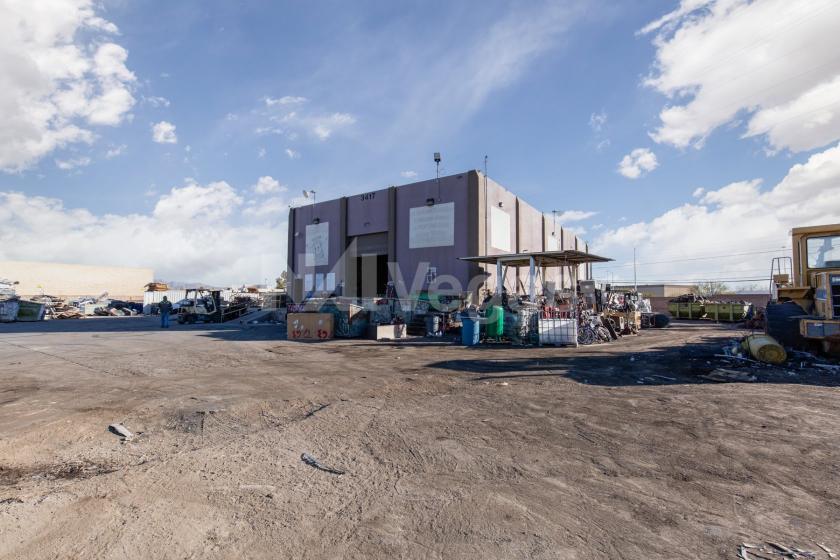
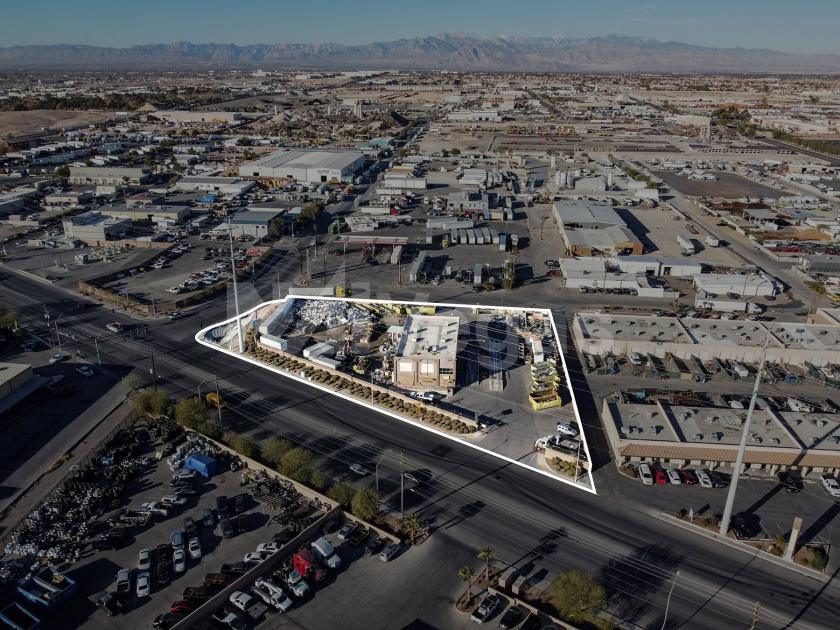
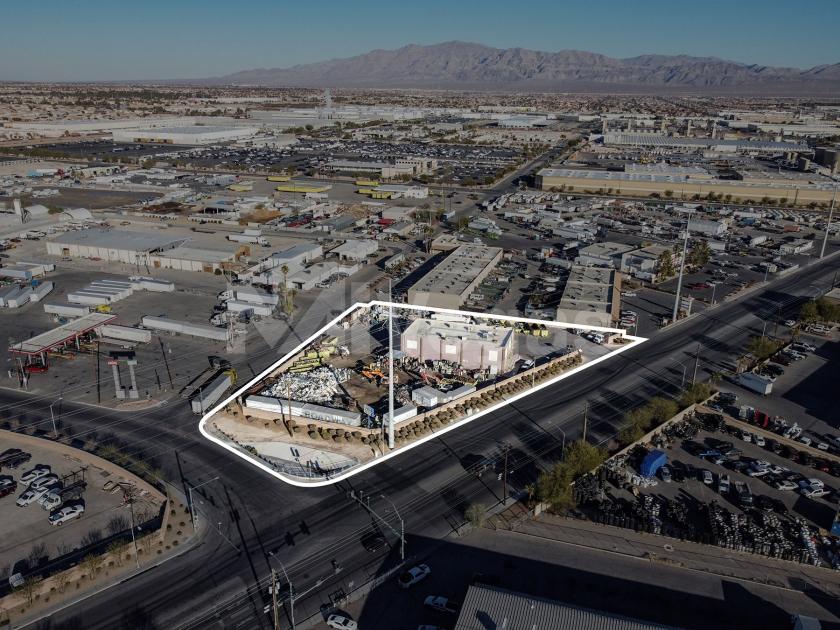
3417 Losee Road North Las Vegas, NV 89030
3417 Losee Road North Las Vegas, NV 89030

Details & Description
Property Highlights
- • M-2 Zoning
- • One (1) Drive-in Doors
- • 18’-20’ Avg Clear Height
- • 3-Phase power
- • Concrete Tilt-up Construction (1974)
- • 5:1,000 Parking Ratio
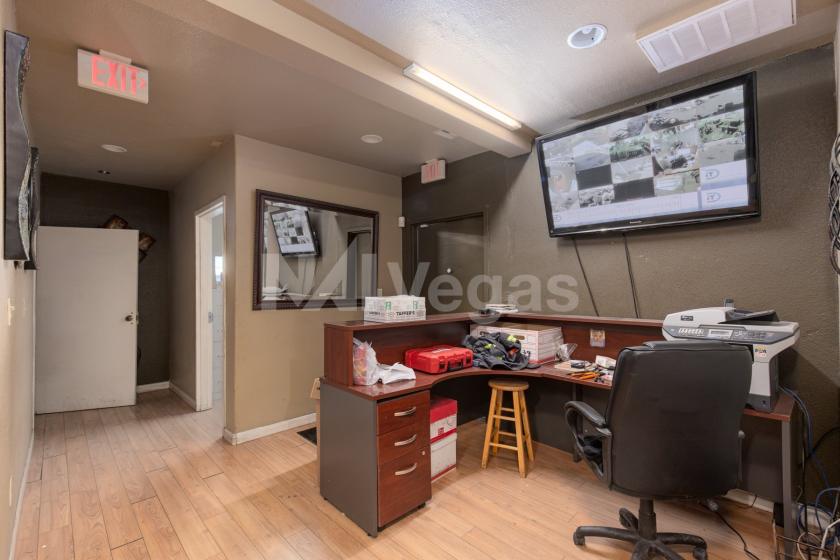
Additional Photos


Listing Agents

Leslie Houston
O: 702-383-3383
M: 702-534-1705
lhouston@naiexcel.com
O: 702-383-3383
M: 702-534-1705
lhouston@naiexcel.com
While we strive to provide the most accurate information, all listing information, and demographic data, is provided by third-parties. As such, MyEListing will not be responsible for the accuracy of the information. It is strongly recommended that you verify all information with the listing agent, and any relevant agencies, prior to making any decisions.