Office Space
3950 Cobb Parkway Northwest Acworth, GA 30101
3950 Cobb Parkway Northwest Acworth, GA 30101

Details & Description
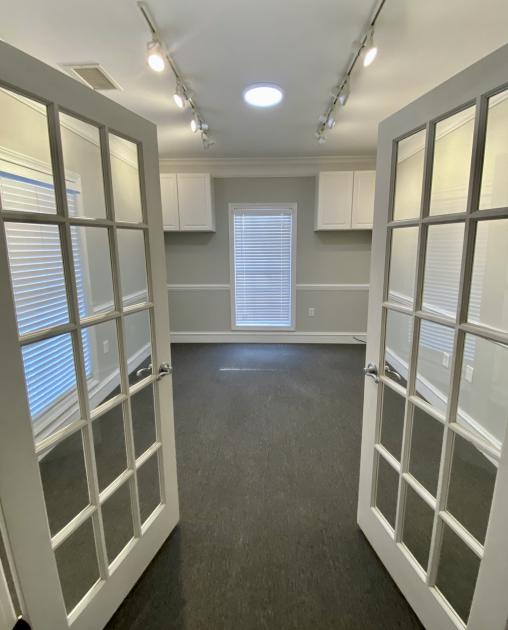
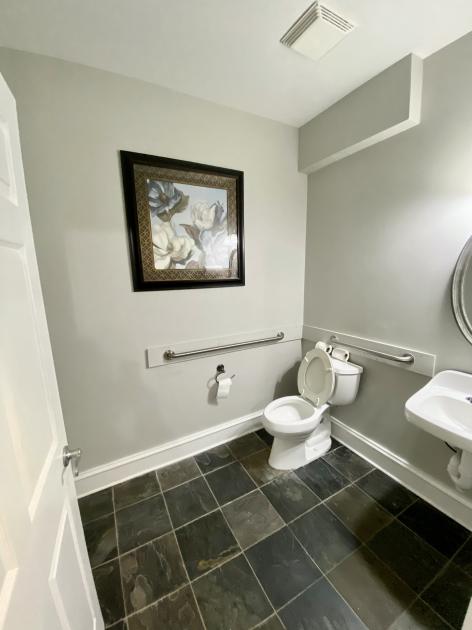
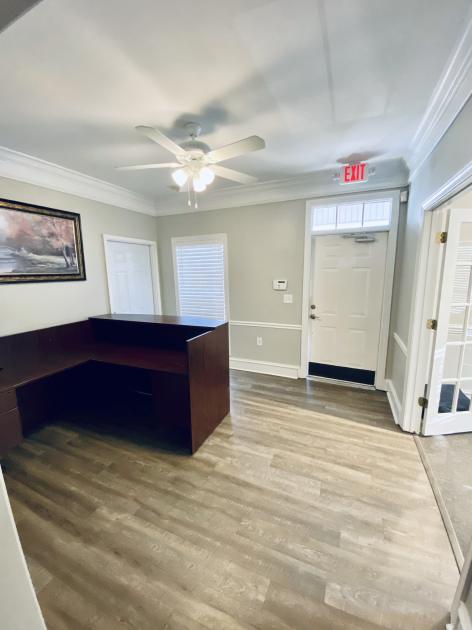
Property Highlights
- • beautifully updated
- • ground floor, end unit
- • 5 offices, reception and break room area
- • estimated daily traffic count of 34,200
Additional Photos


Listing Agents

Donald Edwards Jr.
O: 678-298-1622
M: 770-324-3457
don@dbeproperties.com
O: 678-298-1622
M: 770-324-3457
don@dbeproperties.com
While we strive to provide the most accurate information, all listing information, and demographic data, is provided by third-parties. As such, MyEListing will not be responsible for the accuracy of the information. It is strongly recommended that you verify all information with the listing agent, and any relevant agencies, prior to making any decisions.