Industrial Properties
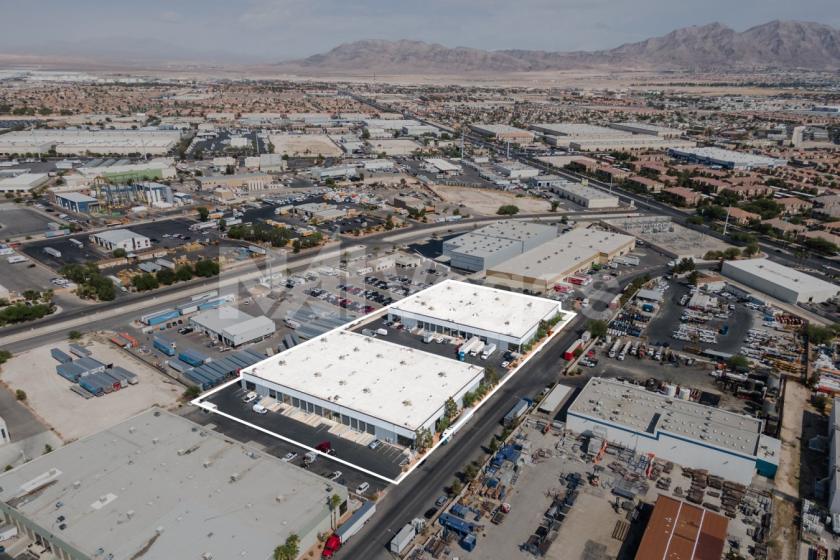
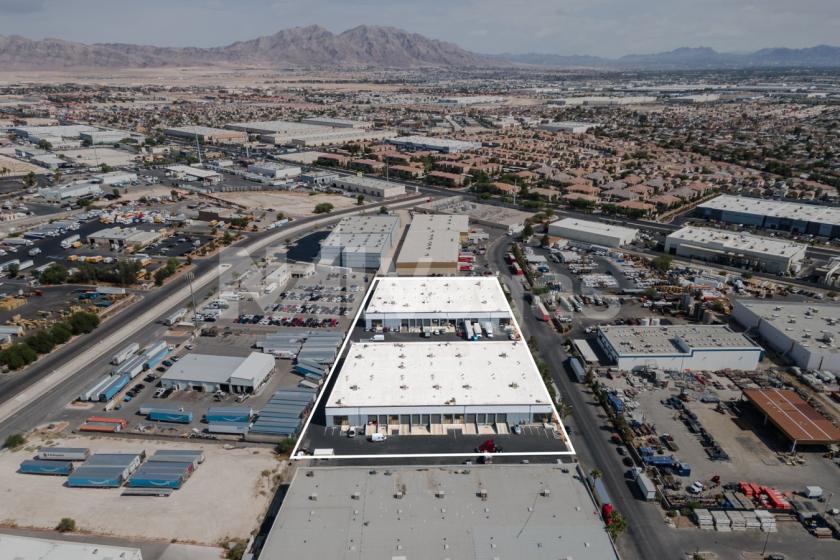
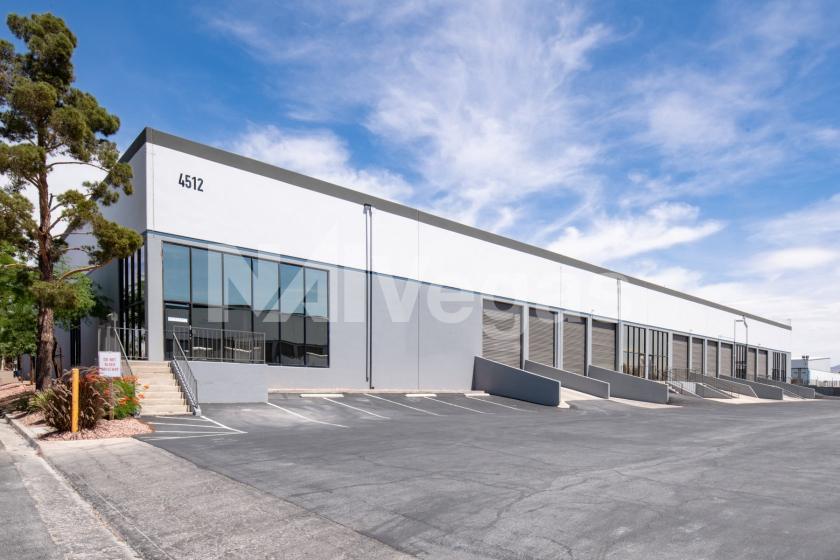
4512 Andrews Street North Las Vegas, NV 89081
4512 Andrews Street North Las Vegas, NV 89081
Details & Description
Property Highlights
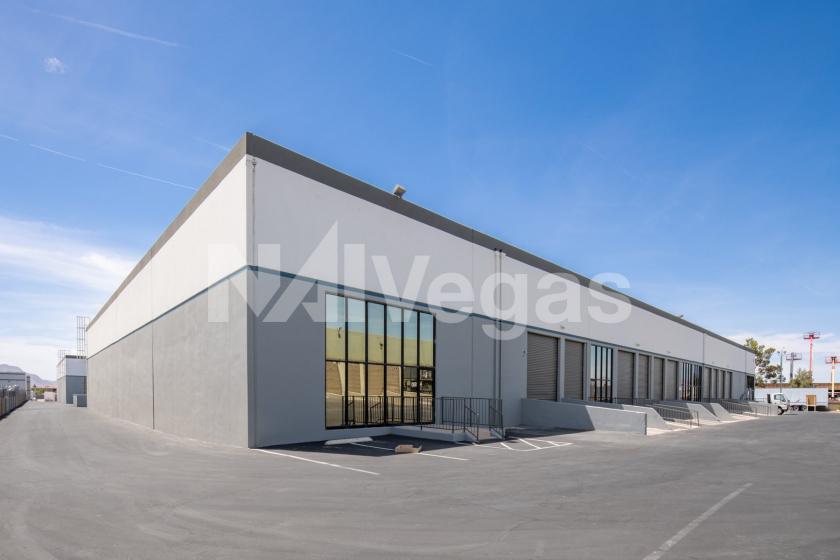
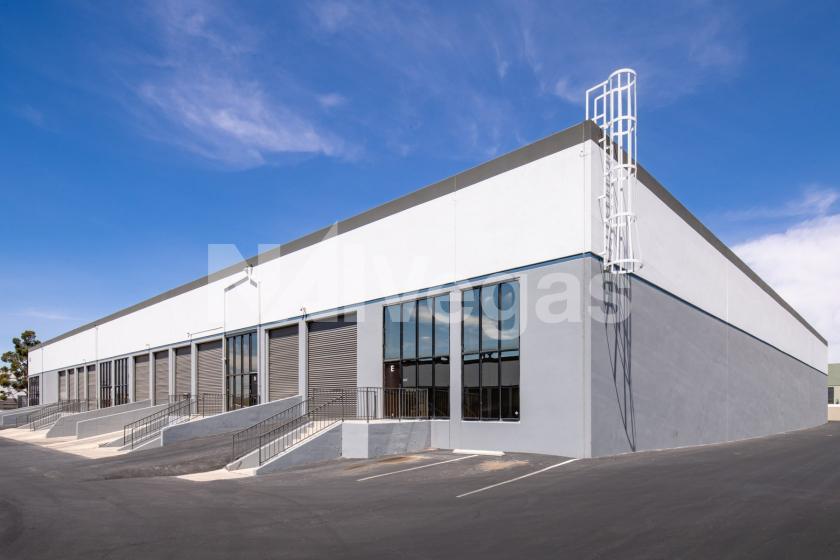
• Each Warehouse Unit Consists of an Office/Restroom with a Reception and Private Office
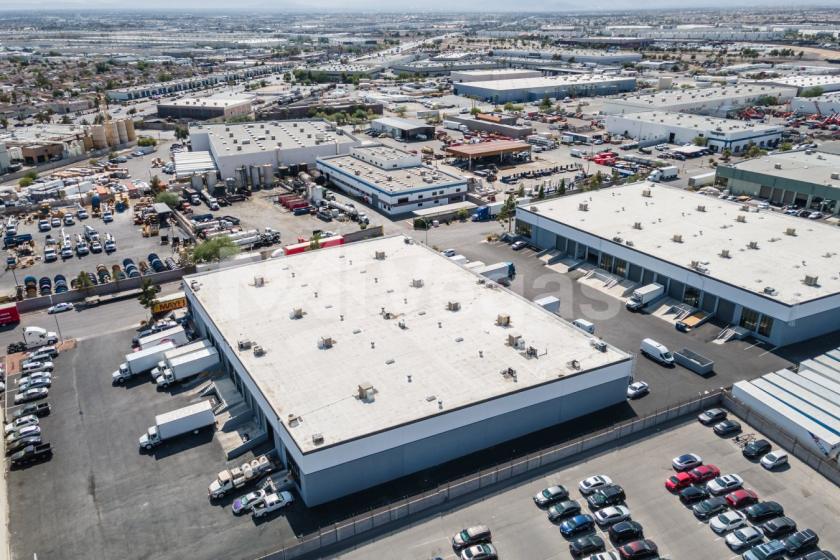
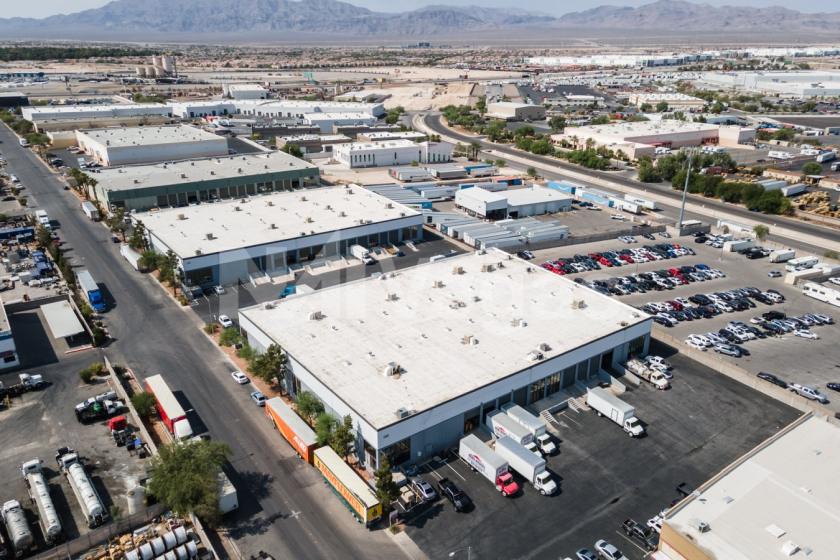
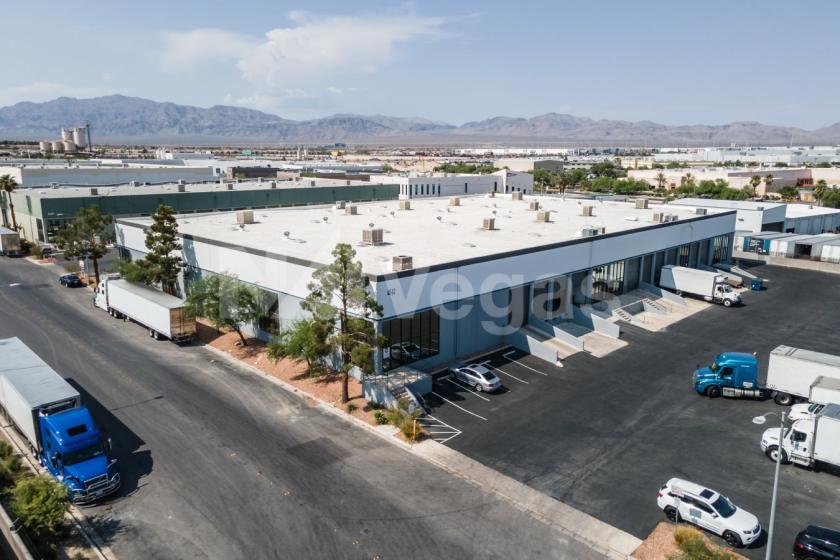
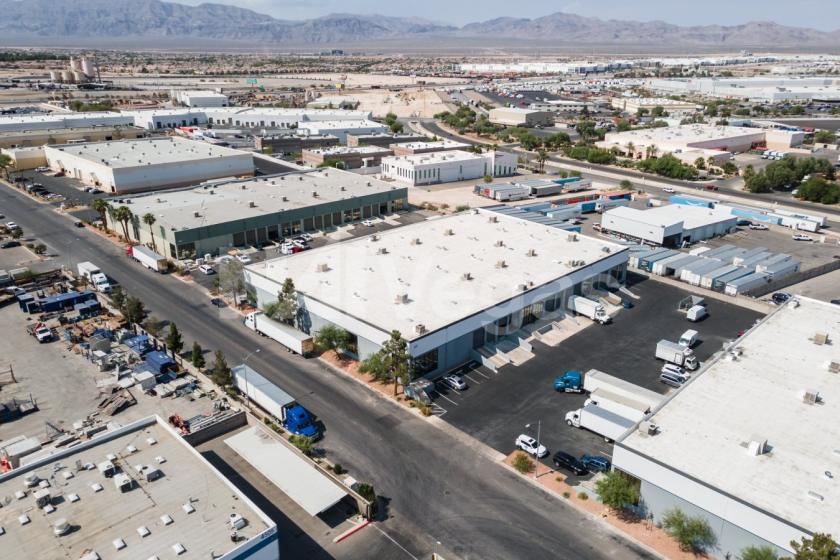
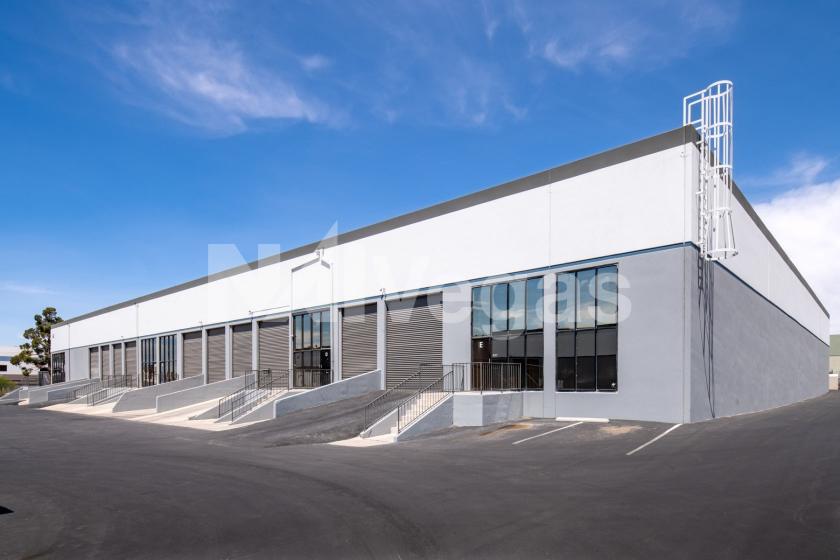
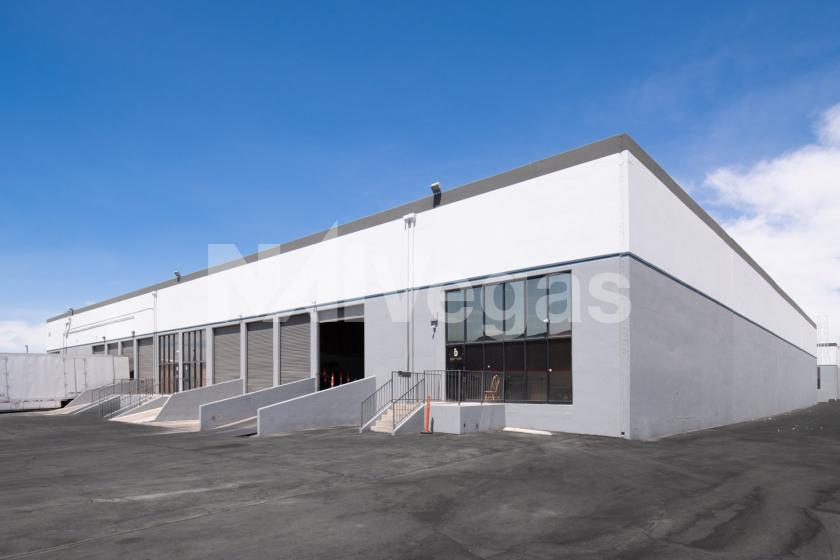
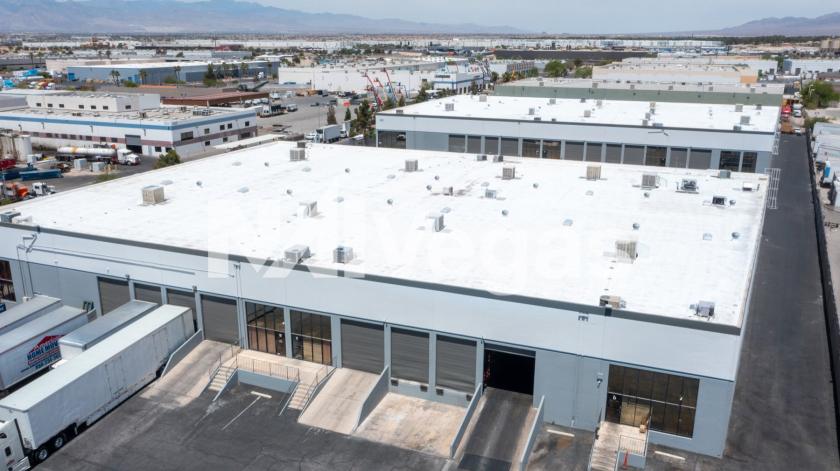
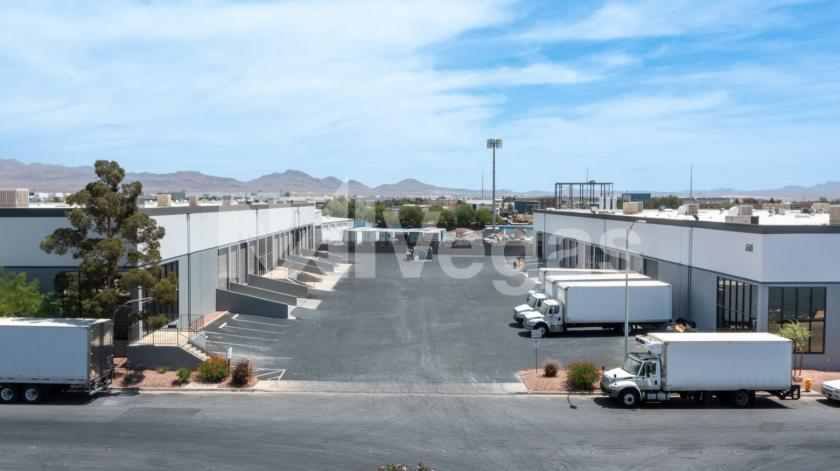
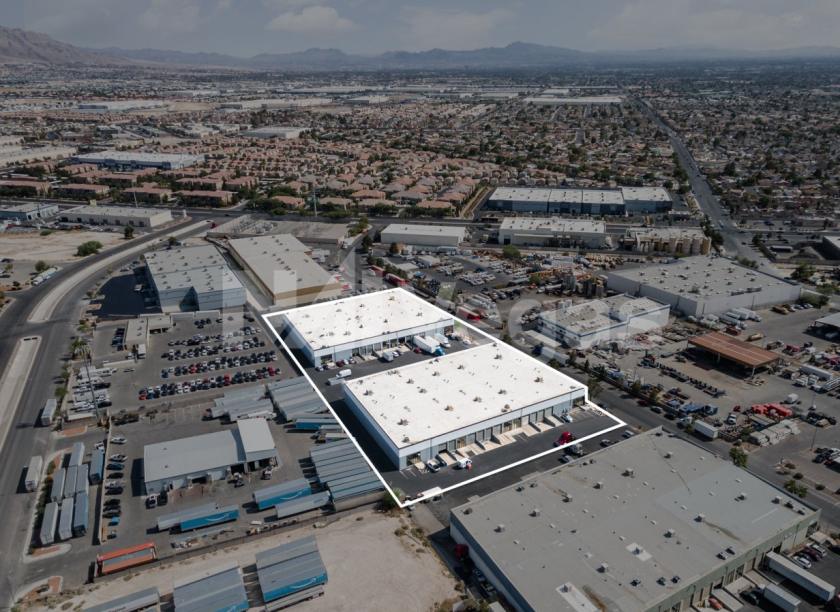
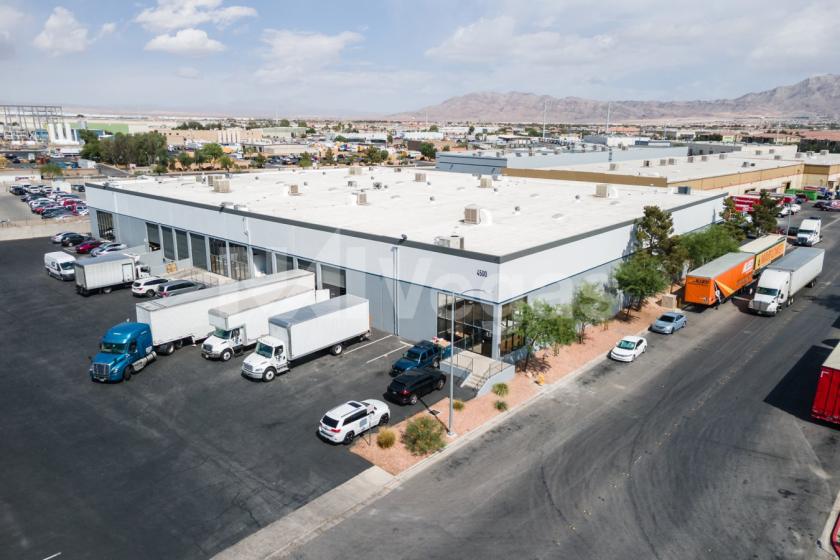
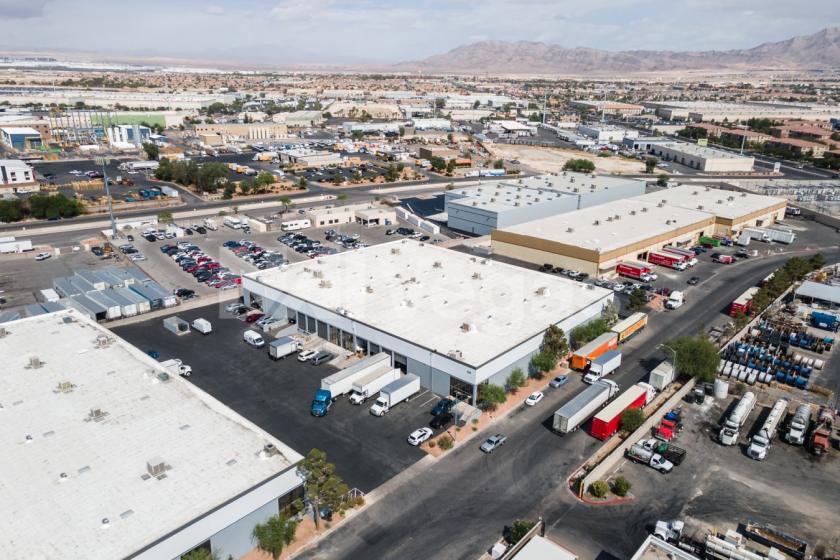
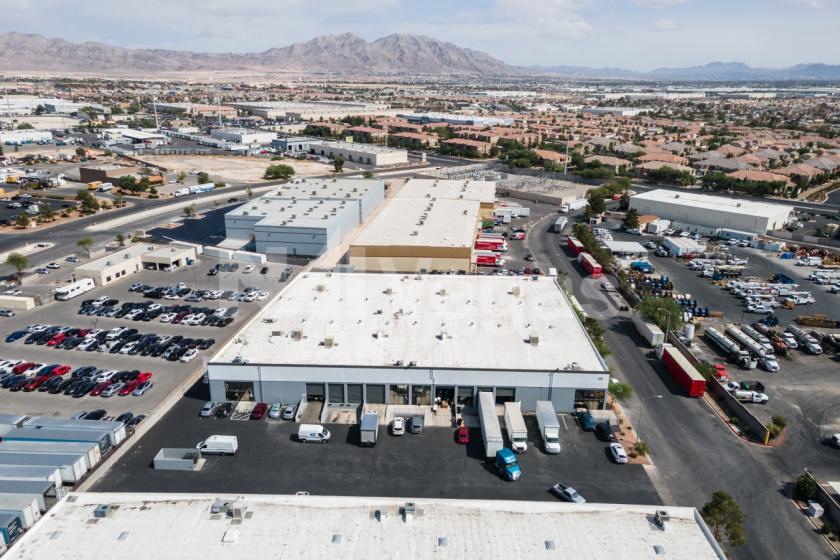
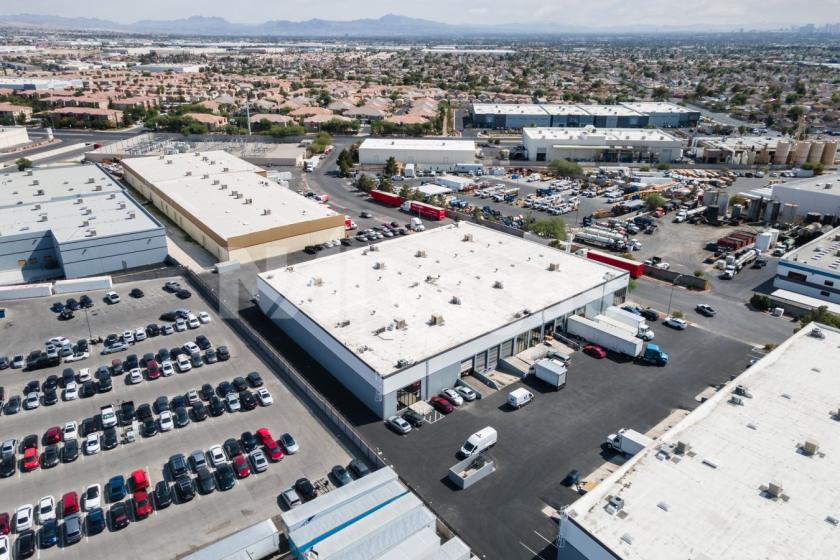
• Two (2) Concrete Tilt-Up Distribution Buildings, ±89,821 Total SF
Additional Photos
Listing Agents

Bryan Houser
O: 702-277-9207
M: 702-534-1714
bhouser@naiexcel.com
O: 702-277-9207
M: 702-534-1714
bhouser@naiexcel.com
While we strive to provide the most accurate information, all listing information, and demographic data, is provided by third-parties. As such, MyEListing will not be responsible for the accuracy of the information. It is strongly recommended that you verify all information with the listing agent, and any relevant agencies, prior to making any decisions.