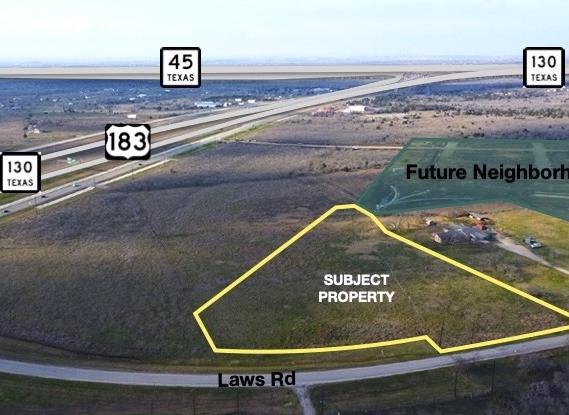
1-Mile | 3-Miles | 5-Miles | ||
---|---|---|---|---|
Total Population | 267 | 3,378 | 11,058 | |
Population Median Age | 38 | 34 | 32 | |
Population by Age | 0-9 Yrs | 30 (11%) | 461 (13%) | 1850 (16%) |
10-19 Yrs | 37 (13%) | 663 (19%) | 1980 (17%) | |
20-29 Yrs | 50 (18%) | 434 (12%) | 1637 (14%) | |
30-39 Yrs | 26 (9%) | 439 (12%) | 1578 (14%) | |
40-49 Yrs | 30 (11%) | 491 (14%) | 1360 (12%) | |
50-59 Yrs | 45 (16%) | 440 (13%) | 1232 (11%) | |
60-69 Yrs | 32 (11%) | 289 (8%) | 911 (8%) | |
70+ Yrs | 18 (6%) | 161 (4%) | 511 (4%) | |
Median HH Income | $56,567 | $60,665 | $63,713 | |
Total Household Income | < 24K | 16 (19%) | 182 (19%) | 422 (14%) |
25-49K | 19 (23%) | 206 (22%) | 722 (25%) | |
50-74K | 18 (22%) | 201 (21%) | 550 (19%) | |
75-99K | 9 (11%) | 150 (16%) | 511 (17%) | |
100-199K | 16 (19%) | 145 (15%) | 486 (17%) | |
200K+ | 2 (2%) | 51 (5%) | 158 (5%) | |
Highest Education Level | No Diploma | 70 | 730 | 2247 |
Diploma or GED | 57 | 625 | 1919 | |
Some College | 29 | 346 | 1056 | |
Assoc. Degree | 9 | 130 | 311 | |
Bachelors Degree | 10 | 169 | 576 | |
Higher Degree | 3 | 31 | 145 | |
Total Housing Units | 85 | 999 | 3,085 | |
--Owner-Occupied | 65 | 747 | 2,288 | |
--Renter-Occupied | 16 | 188 | 560 | |
Owner-Occupied Values | < 100K | 28 | 292 | 743 |
100-199K | 11 | 183 | 714 | |
200-299K | 13 | 161 | 514 | |
300-399K | 9 | 84 | 221 | |
400-499K | 1 | 6 | 17 | |
500K+ | 3 | 22 | 80 | |
Total Working Age Population | 216 | 2,514 | 7,937 | |
In Work Force | 129 | 1,600 | 5,246 | |
Not In Work Force | 87 | 914 | 2,691 | |
Workforce Employed | 124 | 1,532 | 4,948 | |
Workforce Unemployed | 5 | 64 | 272 | |
Civlian Workforce | 129 | 1,596 | 5,220 | |
Military Workforce | 0 | 3 | 27 | |
Total Households | 81 | 935 | 2,848 | |
Family Households | 63 | 738 | 2,293 | |
Non-Family Households | 18 | 196 | 555 | |
Married Couple | 50 | 584 | 1,662 | |
Other Family | 13 | 155 | 631 | |
Married w/Child | 16 | 283 | 877 | |
Single Male w/Child | 1 | 31 | 244 | |
Single Female w/Child | 4 | 55 | 163 |
Population Change Last Two Decades - Plus Projection
2000 | % | 2010 | % | 2020 | % | 2030 | |
---|---|---|---|---|---|---|---|
Texas | 20,851,820 | +21 | 25,145,561 | +18 | 29,677,668 | +18 | 34,894,452 |
Bastrop County | 57,733 | +28 | 74,171 | +16 | 86,105 | +15 | 99,211 |
Travis County | 812,280 | +26 | 1,024,266 | +26 | 1,291,502 | +19 | 1,540,812 |
Caldwell County | 32,194 | +18 | 38,066 | +16 | 44,284 | +15 | 50,777 |
Hays County | 97,589 | +61 | 157,107 | +50 | 234,896 | +48 | 347,120 |
Total Working Age Population:
Total Households:
Total Working Age Population:
Total Households:
Total Working Age Population:
Total Households: