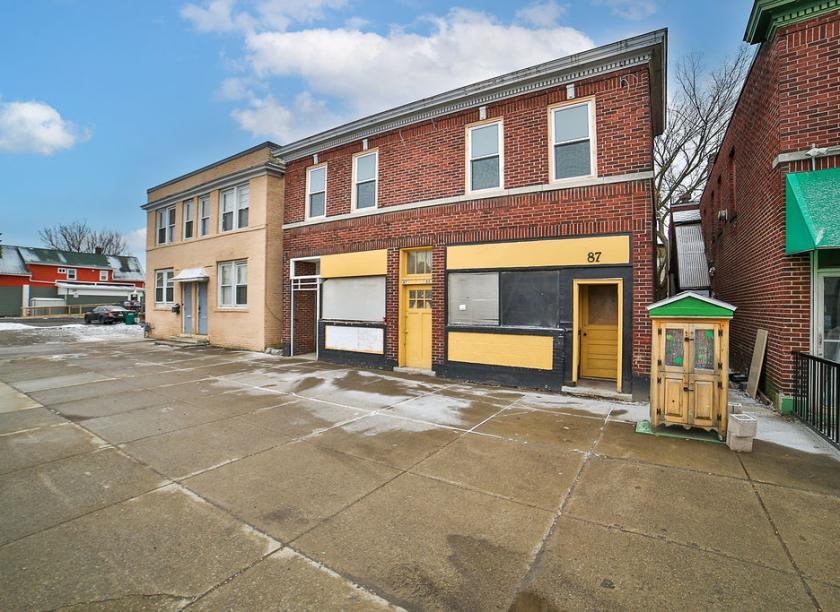
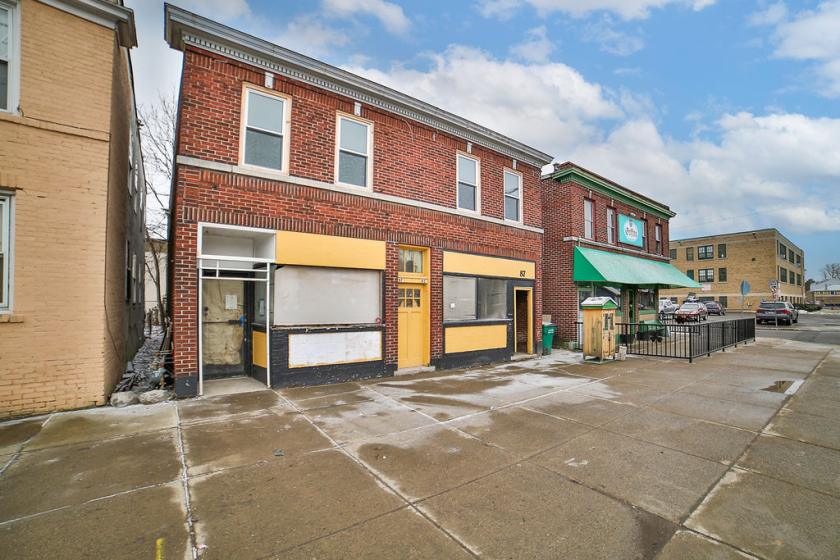
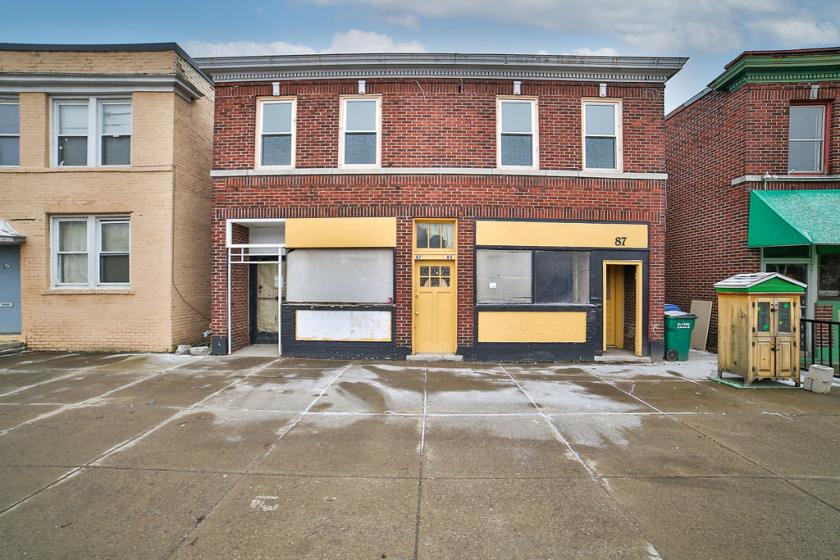
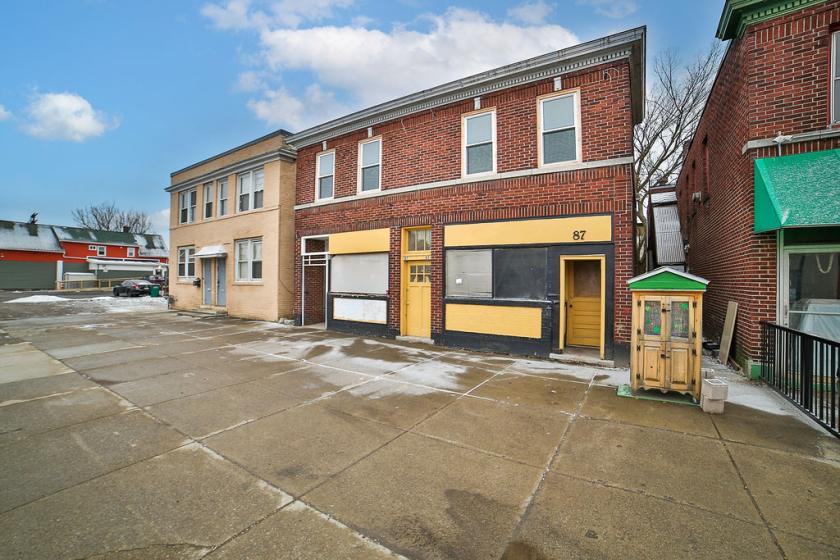
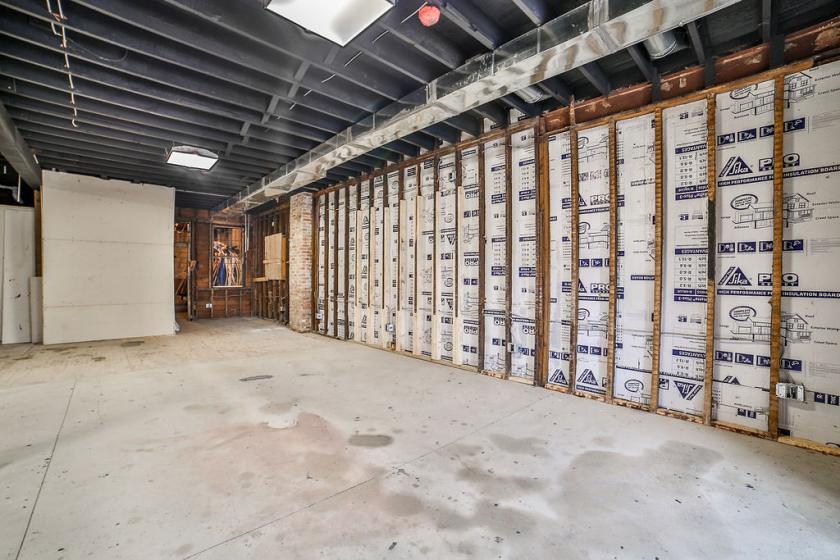
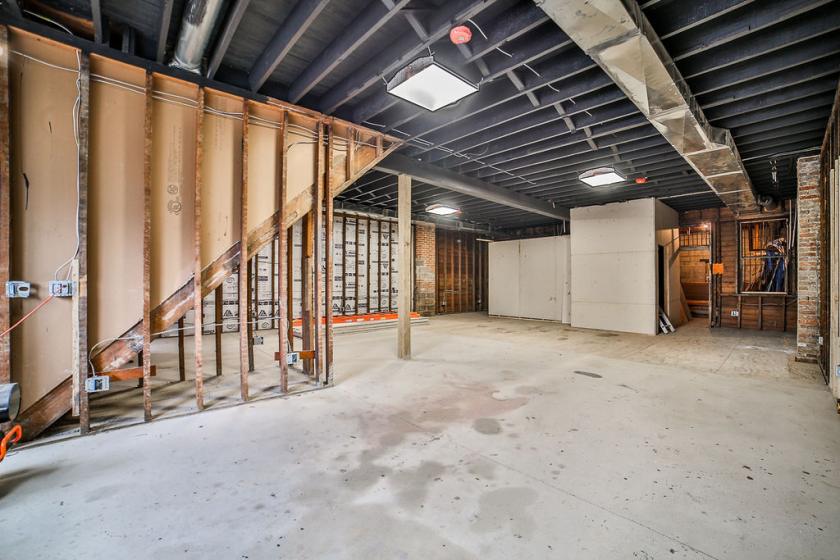
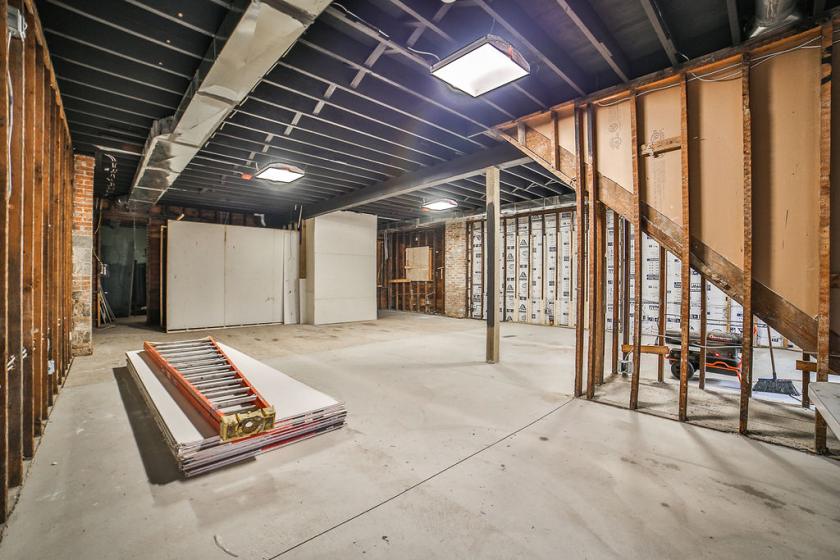
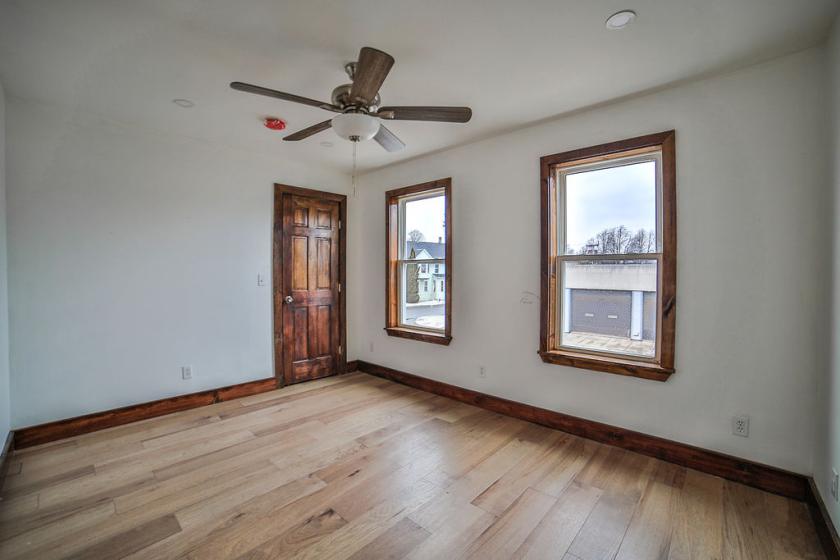
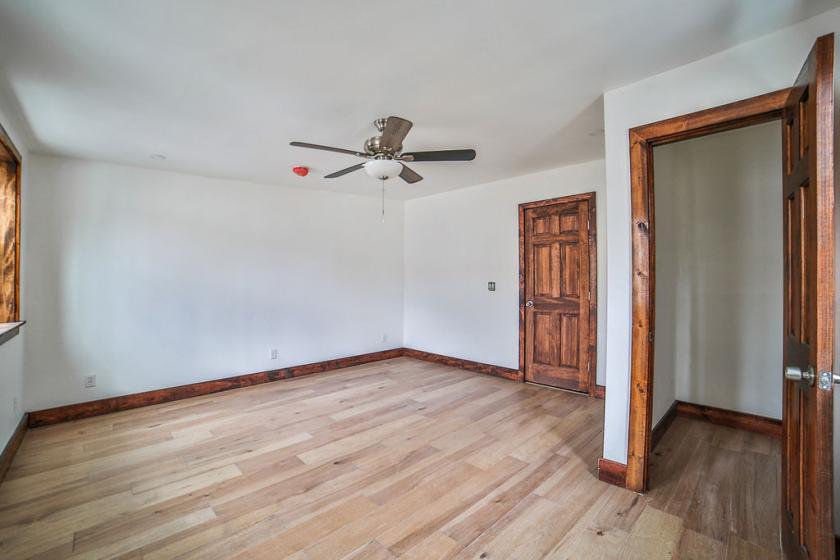
This amazing mixed-use 3,850+/- SF building located close to Downtown Buffalo is ideal for any purchaser. Complete rehabilitated building from basement to roof with the majority of work being completed in 2022-2023. This property offers commercial space on the first floor roughly 1,920+/- SF with an open concept. The building could provide both one or two separate storefronts each with its own front entrance. Any business, retail, office, or professional could utilize this space. The second floor has two mirrored apartments approximately 1,000+/- SF. These apartments were gutted and remodeled in 2023 which includes a new kitchen, bathroom, HVAC, HWT, Laundry (inside the units) lighting, electrical, plumbing, flooring, windows, and so much more. Walk into the unit you're greeted with an open floor plan with the kitchen and living room. Easy access to the bathroom and laundry room in the main hallway. One bedroom is located in the front of the apartment and the second is located in the rear. The property is currently 100% occupied. Great income property for any buyer. Additional key updates include a 2022 complete tear-off roof, 2023 windows, and a 2023 new sewer line out to the street. Per the owner's records, the true Square Footage of the Building is 3,840+/- SF.Located close to Downtown Buffalo, New York, on Abbott Road, this property is centrally located to all major southern Buffalo markets including Lackawanna, West Seneca, Hamburg, Orchard Park, and Cheektowaga. Easily accessible to New York State Thruway I-90 & I-190. Other major attractions to this site include Tesla Gigafactory, Mercy Hospital, Seneca Casino, Key Bank Center, Buffalo Harbor, Buffalo Riverworks, and Buffalo Botanical Gardens.