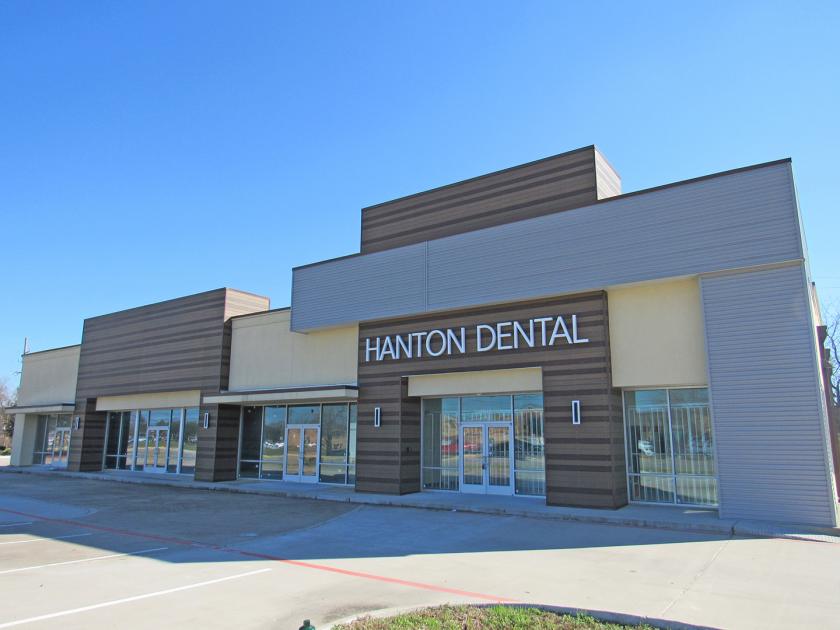
1-Mile | 3-Miles | 5-Miles | ||
---|---|---|---|---|
Total Population | 21,063 | 169,630 | 313,888 | |
Population Median Age | 35 | 34 | 34 | |
Population by Age | 0-9 Yrs | 3354 (15%) | 25095 (14%) | 49118 (15%) |
10-19 Yrs | 3814 (18%) | 30361 (17%) | 51974 (16%) | |
20-29 Yrs | 2299 (10%) | 21460 (12%) | 39614 (12%) | |
30-39 Yrs | 2525 (11%) | 24585 (14%) | 47216 (15%) | |
40-49 Yrs | 2964 (14%) | 25089 (14%) | 46161 (14%) | |
50-59 Yrs | 2473 (11%) | 19839 (11%) | 37201 (11%) | |
60-69 Yrs | 2245 (10%) | 15518 (9%) | 27610 (8%) | |
70+ Yrs | 1388 (6%) | 7684 (4%) | 14993 (4%) | |
Median HH Income | $71,539 | $77,890 | $78,927 | |
Total Household Income | < 24K | 447 (7%) | 4873 (9%) | 8213 (8%) |
25-49K | 1565 (24%) | 9509 (18%) | 17292 (17%) | |
50-74K | 1334 (21%) | 10691 (20%) | 20804 (21%) | |
75-99K | 1160 (18%) | 8318 (15%) | 15107 (15%) | |
100-199K | 1591 (25%) | 15542 (29%) | 28105 (28%) | |
200K+ | 251 (3%) | 3137 (6%) | 7845 (8%) | |
Highest Education Level | No Diploma | 2440 | 15573 | 27038 |
Diploma or GED | 3132 | 22474 | 40274 | |
Some College | 2979 | 22304 | 43471 | |
Assoc. Degree | 1130 | 9365 | 16839 | |
Bachelors Degree | 2300 | 23866 | 46718 | |
Higher Degree | 753 | 9754 | 19309 | |
Total Housing Units | 6,582 | 54,619 | 103,198 | |
--Owner-Occupied | 4,202 | 37,146 | 69,252 | |
--Renter-Occupied | 2,146 | 14,924 | 28,114 | |
Owner-Occupied Values | < 100K | 355 | 1870 | 3571 |
100-199K | 2611 | 20604 | 34446 | |
200-299K | 985 | 11152 | 21339 | |
300-399K | 94 | 2553 | 6235 | |
400-499K | 6 | 532 | 1972 | |
500K+ | 152 | 436 | 1691 | |
Total Working Age Population | 15,175 | 124,590 | 230,993 | |
In Work Force | 9,657 | 87,992 | 164,255 | |
Not In Work Force | 5,518 | 36,597 | 66,738 | |
Workforce Employed | 9,301 | 82,542 | 154,628 | |
Workforce Unemployed | 356 | 5,450 | 9,603 | |
Civlian Workforce | 9,657 | 87,992 | 164,231 | |
Military Workforce | 0 | 0 | 23 | |
Total Households | 6,348 | 52,070 | 97,366 | |
Family Households | 5,309 | 41,534 | 77,065 | |
Non-Family Households | 1,040 | 10,536 | 20,301 | |
Married Couple | 3,482 | 29,681 | 56,775 | |
Other Family | 1,827 | 11,853 | 20,290 | |
Married w/Child | 1,799 | 15,769 | 30,064 | |
Single Male w/Child | 76 | 975 | 2,088 | |
Single Female w/Child | 791 | 5,533 | 8,427 |
Population Change Last Two Decades - Plus Projection
2000 | % | 2010 | % | 2020 | % | 2030 | |
---|---|---|---|---|---|---|---|
Texas | 20,851,820 | +21 | 25,145,561 | +18 | 29,677,668 | +18 | 34,894,452 |
Harris County | 3,400,578 | +20 | 4,092,459 | +22 | 4,978,845 | +19 | 5,924,750 |
Total Working Age Population:
Total Households:
Total Working Age Population:
Total Households:
Total Working Age Population:
Total Households: