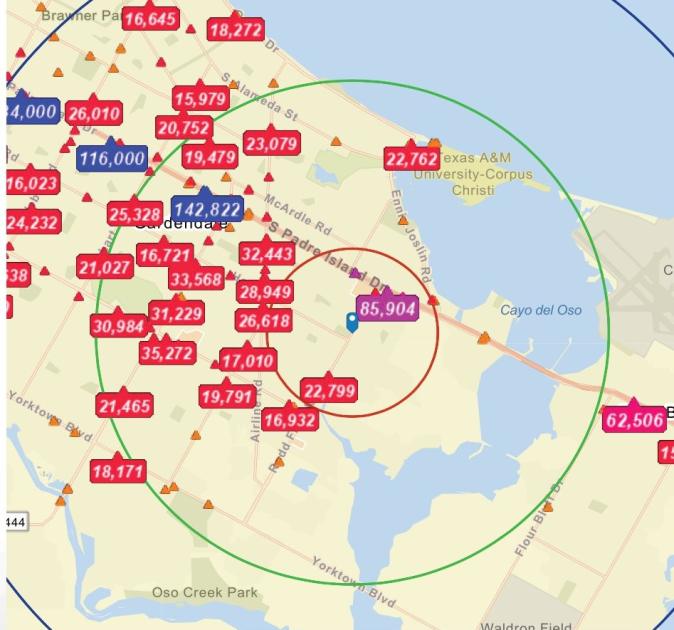
1-Mile | 3-Miles | 5-Miles | ||
---|---|---|---|---|
Total Population | 11,530 | 83,939 | 173,403 | |
Population Median Age | 36 | 34 | 36 | |
Population by Age | 0-9 Yrs | 1508 (13%) | 11416 (13%) | 24155 (13%) |
10-19 Yrs | 1005 (8%) | 12126 (14%) | 24550 (14%) | |
20-29 Yrs | 2854 (24%) | 17259 (20%) | 30497 (17%) | |
30-39 Yrs | 1948 (16%) | 11968 (14%) | 23305 (13%) | |
40-49 Yrs | 1093 (9%) | 9655 (11%) | 20568 (11%) | |
50-59 Yrs | 1205 (10%) | 8335 (9%) | 19324 (11%) | |
60-69 Yrs | 913 (7%) | 6593 (7%) | 16162 (9%) | |
70+ Yrs | 1003 (8%) | 6588 (7%) | 14843 (8%) | |
Median HH Income | $58,679 | $63,816 | $64,858 | |
Total Household Income | < 24K | 972 (20%) | 5923 (18%) | 11349 (17%) |
25-49K | 936 (19%) | 6542 (20%) | 13050 (20%) | |
50-74K | 940 (19%) | 6059 (18%) | 11971 (18%) | |
75-99K | 721 (14%) | 5023 (15%) | 9363 (14%) | |
100-199K | 1104 (22%) | 7240 (22%) | 14719 (23%) | |
200K+ | 180 (3%) | 1338 (4%) | 3382 (5%) | |
Highest Education Level | No Diploma | 467 | 4105 | 9454 |
Diploma or GED | 1844 | 13054 | 29249 | |
Some College | 1955 | 13175 | 29123 | |
Assoc. Degree | 1053 | 6219 | 11418 | |
Bachelors Degree | 1438 | 9133 | 19018 | |
Higher Degree | 604 | 5635 | 11601 | |
Total Housing Units | 5,115 | 34,454 | 69,519 | |
--Owner-Occupied | 2,539 | 15,102 | 35,435 | |
--Renter-Occupied | 2,314 | 17,024 | 28,398 | |
Owner-Occupied Values | < 100K | 292 | 2043 | 5033 |
100-199K | 1599 | 7304 | 17644 | |
200-299K | 540 | 4298 | 8203 | |
300-399K | 98 | 827 | 2521 | |
400-499K | 7 | 227 | 815 | |
500K+ | 2 | 404 | 1218 | |
Total Working Age Population | 9,348 | 66,727 | 135,776 | |
In Work Force | 6,756 | 45,330 | 90,235 | |
Not In Work Force | 2,592 | 21,396 | 45,542 | |
Workforce Employed | 6,347 | 41,897 | 83,839 | |
Workforce Unemployed | 259 | 2,449 | 4,834 | |
Civlian Workforce | 6,606 | 44,345 | 88,673 | |
Military Workforce | 150 | 985 | 1,562 | |
Total Households | 4,853 | 32,126 | 63,833 | |
Family Households | 2,814 | 19,561 | 41,567 | |
Non-Family Households | 2,039 | 12,565 | 22,266 | |
Married Couple | 2,077 | 13,706 | 29,094 | |
Other Family | 737 | 5,855 | 12,472 | |
Married w/Child | 860 | 5,823 | 12,349 | |
Single Male w/Child | 75 | 781 | 1,580 | |
Single Female w/Child | 284 | 2,509 | 4,663 |
Population Change Last Two Decades - Plus Projection
2000 | % | 2010 | % | 2020 | % | 2030 | |
---|---|---|---|---|---|---|---|
Texas | 20,851,820 | +21 | 25,145,561 | +18 | 29,677,668 | +18 | 34,894,452 |
Nueces County | 313,645 | +8 | 340,223 | +13 | 383,718 | +12 | 429,517 |
Total Working Age Population:
Total Households:
Total Working Age Population:
Total Households:
Total Working Age Population:
Total Households: