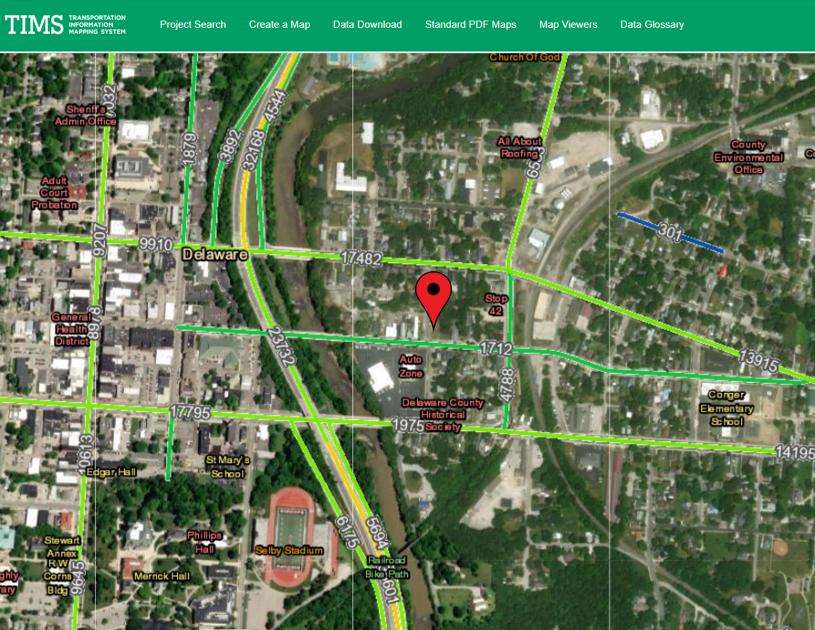
1-Mile | 3-Miles | 5-Miles | ||
---|---|---|---|---|
Total Population | 8,134 | 35,092 | 49,093 | |
Population Median Age | 36 | 38 | 37 | |
Population by Age | 0-9 Yrs | 842 (10%) | 4237 (12%) | 6463 (13%) |
10-19 Yrs | 1217 (14%) | 4768 (13%) | 6690 (13%) | |
20-29 Yrs | 1661 (20%) | 5125 (14%) | 6410 (13%) | |
30-39 Yrs | 1254 (15%) | 5117 (14%) | 7279 (14%) | |
40-49 Yrs | 791 (9%) | 4673 (13%) | 7021 (14%) | |
50-59 Yrs | 942 (11%) | 4069 (11%) | 5875 (11%) | |
60-69 Yrs | 950 (11%) | 3990 (11%) | 5202 (10%) | |
70+ Yrs | 477 (5%) | 3113 (8%) | 4154 (8%) | |
Median HH Income | $62,691 | $70,050 | $77,572 | |
Total Household Income | < 24K | 594 (20%) | 2267 (17%) | 2779 (15%) |
25-49K | 663 (22%) | 2588 (19%) | 3179 (17%) | |
50-74K | 508 (17%) | 2190 (16%) | 2850 (15%) | |
75-99K | 255 (8%) | 2205 (16%) | 2847 (15%) | |
100-199K | 713 (24%) | 3376 (25%) | 5155 (28%) | |
200K+ | 160 (5%) | 614 (4%) | 1392 (7%) | |
Highest Education Level | No Diploma | 361 | 1401 | 1812 |
Diploma or GED | 1442 | 6165 | 7919 | |
Some College | 1136 | 4901 | 6551 | |
Assoc. Degree | 350 | 1769 | 2436 | |
Bachelors Degree | 1042 | 5793 | 8683 | |
Higher Degree | 772 | 3265 | 5060 | |
Total Housing Units | 3,101 | 13,924 | 19,088 | |
--Owner-Occupied | 1,649 | 8,550 | 12,325 | |
--Renter-Occupied | 1,244 | 4,691 | 5,878 | |
Owner-Occupied Values | < 100K | 341 | 1353 | 1548 |
100-199K | 637 | 3589 | 4362 | |
200-299K | 408 | 2625 | 3889 | |
300-399K | 204 | 778 | 1678 | |
400-499K | 59 | 147 | 563 | |
500K+ | 0 | 57 | 284 | |
Total Working Age Population | 6,784 | 28,434 | 39,009 | |
In Work Force | 4,433 | 19,485 | 26,968 | |
Not In Work Force | 2,351 | 8,949 | 12,041 | |
Workforce Employed | 4,224 | 18,696 | 25,896 | |
Workforce Unemployed | 198 | 747 | 1,001 | |
Civlian Workforce | 4,421 | 19,443 | 26,897 | |
Military Workforce | 12 | 43 | 70 | |
Total Households | 2,893 | 13,241 | 18,203 | |
Family Households | 1,777 | 8,658 | 12,197 | |
Non-Family Households | 1,116 | 4,583 | 6,006 | |
Married Couple | 1,288 | 6,502 | 9,653 | |
Other Family | 489 | 2,156 | 2,543 | |
Married w/Child | 546 | 2,879 | 4,623 | |
Single Male w/Child | 51 | 342 | 433 | |
Single Female w/Child | 176 | 643 | 761 |
Population Change Last Two Decades - Plus Projection
2000 | % | 2010 | % | 2020 | % | 2030 | |
---|---|---|---|---|---|---|---|
Ohio | 11,353,140 | +2 | 11,536,504 | 0 | 11,574,870 | 0 | 11,615,100 |
Delaware County | 109,989 | +58 | 174,214 | +21 | 210,630 | +17 | 246,000 |
Total Working Age Population:
Total Households:
Total Working Age Population:
Total Households:
Total Working Age Population:
Total Households: