Commercial Land
6500 North Main Street Houston, TX 77009
6500 North Main Street Houston, TX 77009

Details & Description
Property Highlights
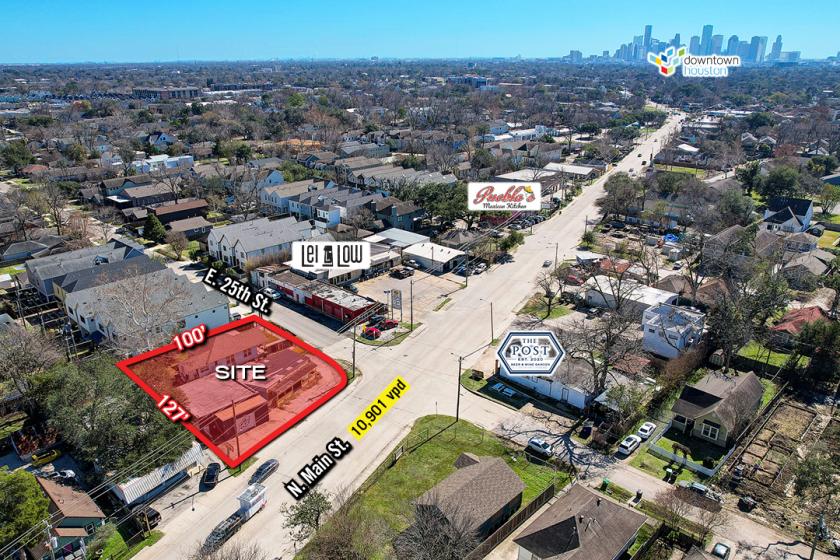
- • 10,800 SF Corner Lot
- • Excellent Visibility
- • Ideal for Retail Redevelopment
- • No Restrictions
- • High Avg HH Income w/in 1 Mile ($122K+)
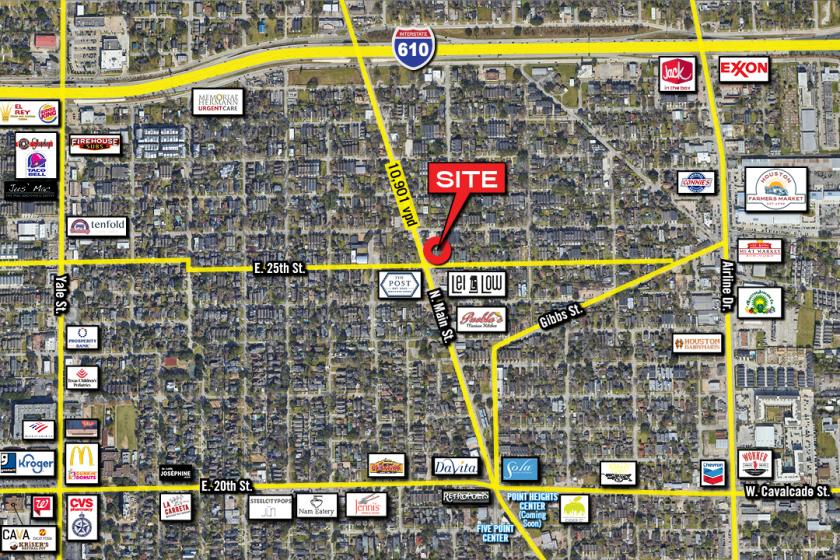
- • Close Proximity to 610
Additional Photos

Listing Agents

Ryan Neyland
O: 281-995-2200
M: 713-398-9560
ryan@palodurocp.com
O: 281-995-2200
M: 713-398-9560
ryan@palodurocp.com
While we strive to provide the most accurate information, all listing information, and demographic data, is provided by third-parties. As such, MyEListing will not be responsible for the accuracy of the information. It is strongly recommended that you verify all information with the listing agent, and any relevant agencies, prior to making any decisions.


