Retail Space
4602 Wattbourne Lane Louisville, KY 40299
4602 Wattbourne Lane Louisville, KY 40299

Details & Description
Property Highlights
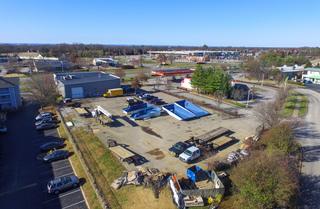
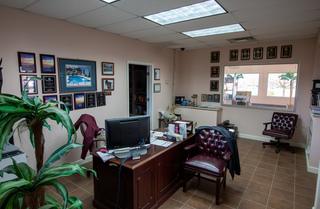
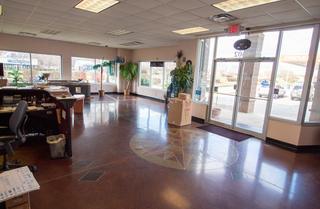
- • 5,600 SF Office/Retail/Warehouse
- • Paved Fenced Lot
- • Drive-in Bay
- • High Residential Density Location
Additional Photos


Listing Agents

Stephanie Gilezan
O: 502-640-3622
commercial@gilezanteam.com
O: 502-640-3622
commercial@gilezanteam.com
While we strive to provide the most accurate information, all listing information, and demographic data, is provided by third-parties. As such, MyEListing will not be responsible for the accuracy of the information. It is strongly recommended that you verify all information with the listing agent, and any relevant agencies, prior to making any decisions.