Retail Space
1307 Wells Branch Parkway Pflugerville, TX 78660
1307 Wells Branch Parkway Pflugerville, TX 78660
Details & Description
Property Highlights
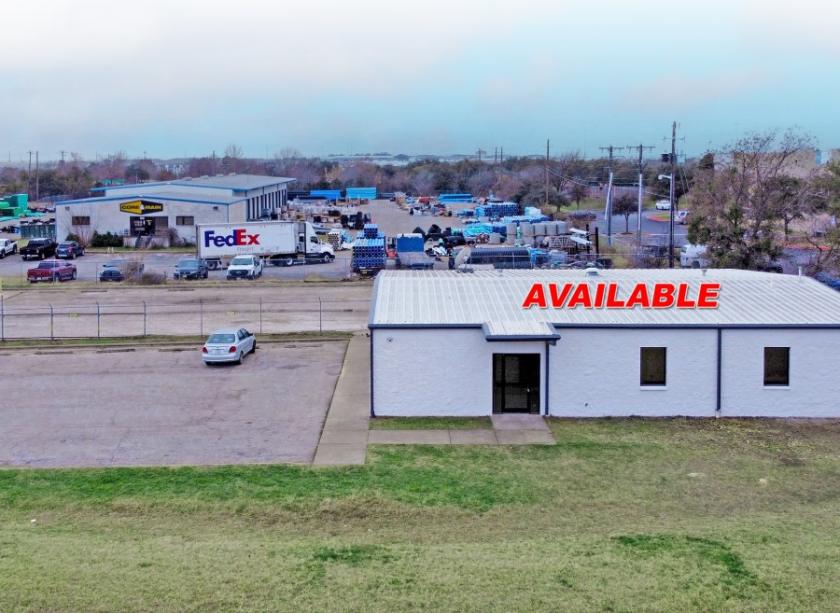
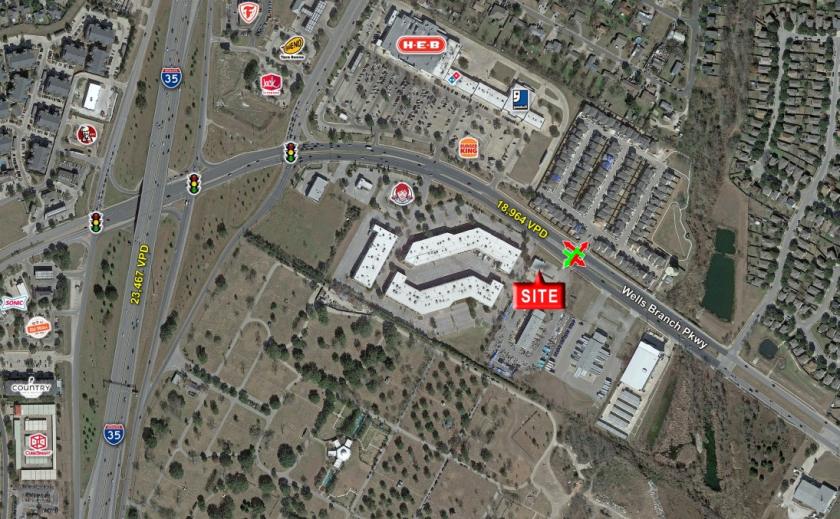
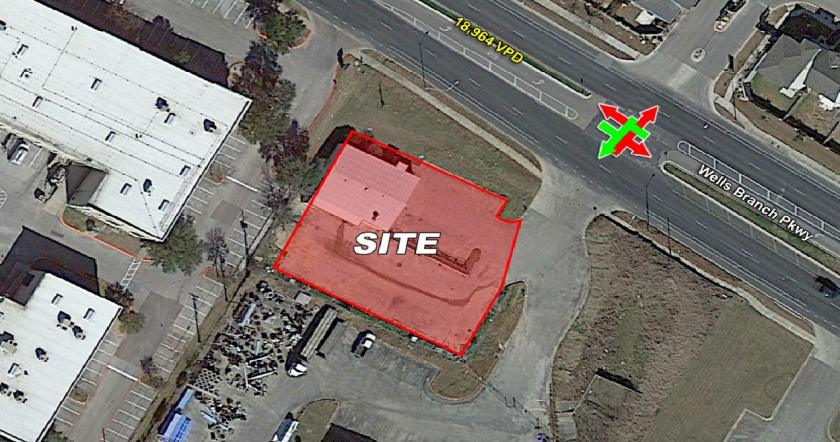
• Free standing building with great visibility to Wells Branch
• Gated and fenced-in storage/yard area.
Additional Photos

Listing Agents

Joey Mendez
O: 512-921-4071
joey@resolutre.com
O: 512-921-4071
joey@resolutre.com

Michael Noteboom
O: 512-695-6958
mnoteboom@resolutre.com
O: 512-695-6958
mnoteboom@resolutre.com
While we strive to provide the most accurate information, all listing information, and demographic data, is provided by third-parties. As such, MyEListing will not be responsible for the accuracy of the information. It is strongly recommended that you verify all information with the listing agent, and any relevant agencies, prior to making any decisions.


