Retail Space
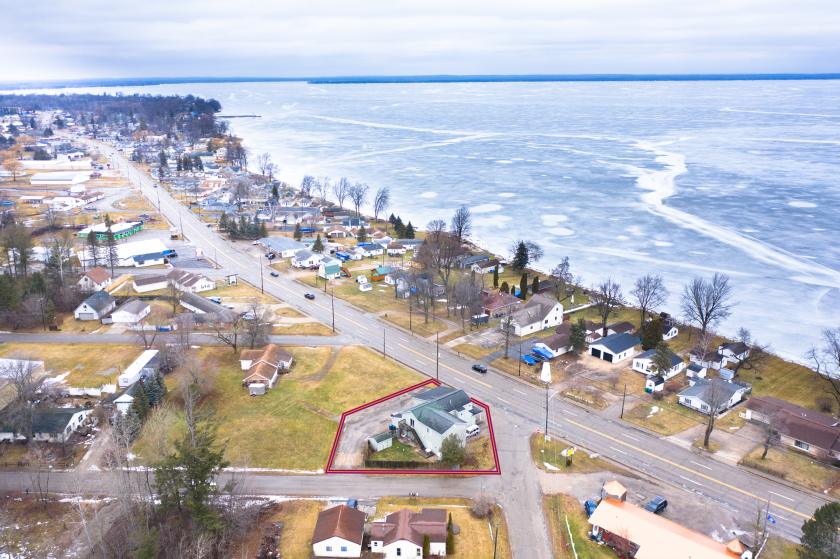
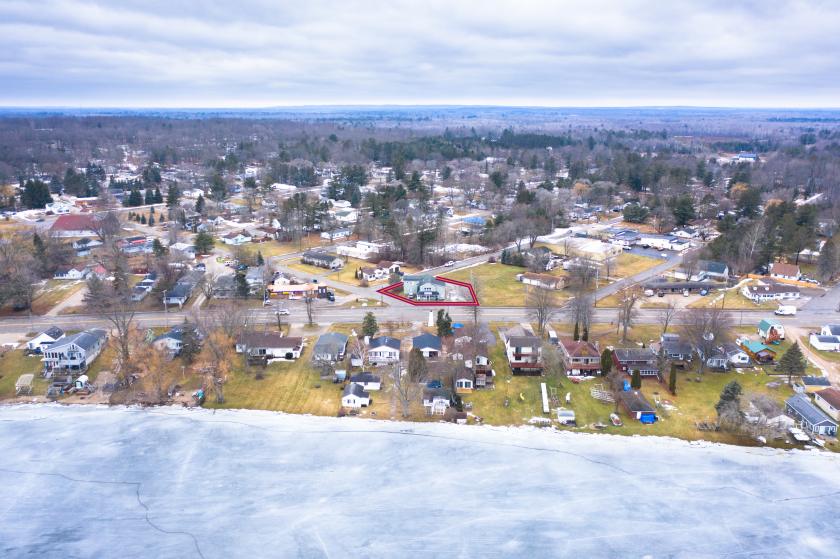
6123 West Houghton Lake Drive Houghton Lake, MI 48629
6123 West Houghton Lake Drive Houghton Lake, MI 48629

Details & Description
Property Highlights
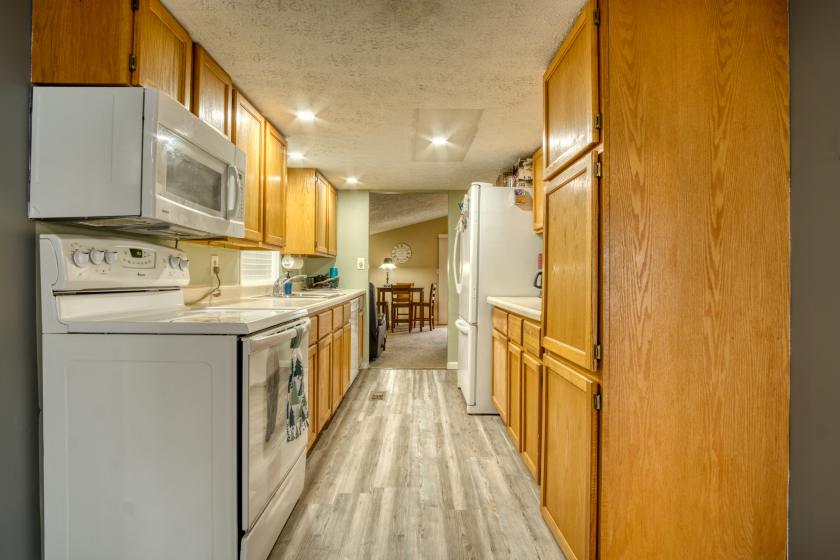
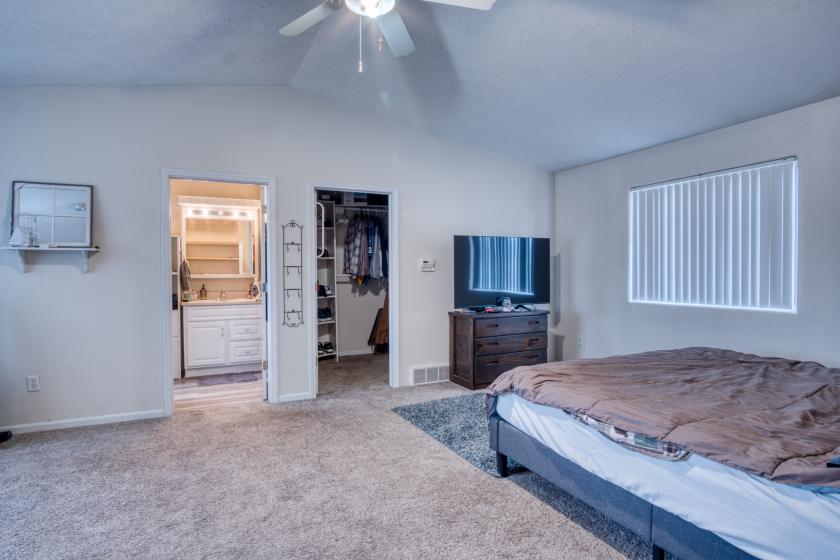
• Includes spacious 3 bedroom 2 bathroom home above the commercial space
• Across the street from Houghton Lake
Additional Photos


Listing Agents

Mary Peacock
O: 231-856-4456
listings@peacockrealestate.com
O: 231-856-4456
listings@peacockrealestate.com
While we strive to provide the most accurate information, all listing information, and demographic data, is provided by third-parties. As such, MyEListing will not be responsible for the accuracy of the information. It is strongly recommended that you verify all information with the listing agent, and any relevant agencies, prior to making any decisions.