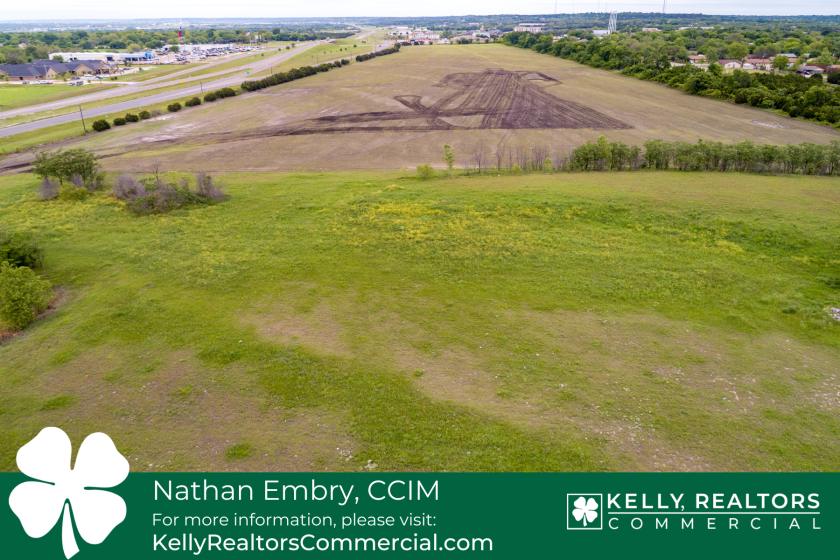
1-Mile | 3-Miles | 5-Miles | ||
---|---|---|---|---|
Total Population | 1,321 | 7,511 | 16,030 | |
Population Median Age | 40 | 39 | 40 | |
Population by Age | 0-9 Yrs | 181 (13%) | 860 (11%) | 1186 (7%) |
10-19 Yrs | 155 (11%) | 777 (10%) | 1124 (7%) | |
20-29 Yrs | 79 (5%) | 758 (10%) | 2131 (13%) | |
30-39 Yrs | 242 (18%) | 1630 (21%) | 3819 (23%) | |
40-49 Yrs | 143 (10%) | 1112 (14%) | 3024 (18%) | |
50-59 Yrs | 225 (17%) | 1021 (13%) | 2442 (15%) | |
60-69 Yrs | 140 (10%) | 685 (9%) | 1298 (8%) | |
70+ Yrs | 156 (11%) | 668 (8%) | 1005 (6%) | |
Median HH Income | $46,157 | $48,012 | $49,190 | |
Total Household Income | < 24K | 156 (28%) | 555 (24%) | 667 (22%) |
25-49K | 150 (26%) | 627 (27%) | 834 (28%) | |
50-74K | 84 (15%) | 419 (18%) | 524 (17%) | |
75-99K | 79 (14%) | 266 (11%) | 377 (12%) | |
100-199K | 72 (12%) | 364 (15%) | 490 (16%) | |
200K+ | 17 (3%) | 47 (2%) | 59 (1%) | |
Highest Education Level | No Diploma | 83 | 906 | 2881 |
Diploma or GED | 337 | 1589 | 3992 | |
Some College | 283 | 1783 | 4028 | |
Assoc. Degree | 65 | 424 | 867 | |
Bachelors Degree | 120 | 566 | 942 | |
Higher Degree | 73 | 370 | 498 | |
Total Housing Units | 604 | 2,694 | 3,496 | |
--Owner-Occupied | 332 | 1,560 | 2,112 | |
--Renter-Occupied | 225 | 718 | 839 | |
Owner-Occupied Values | < 100K | 164 | 616 | 830 |
100-199K | 136 | 695 | 877 | |
200-299K | 27 | 190 | 264 | |
300-399K | 2 | 30 | 76 | |
400-499K | 3 | 16 | 24 | |
500K+ | 1 | 12 | 41 | |
Total Working Age Population | 1,000 | 6,102 | 14,085 | |
In Work Force | 569 | 2,496 | 3,283 | |
Not In Work Force | 431 | 3,606 | 10,802 | |
Workforce Employed | 534 | 2,262 | 3,002 | |
Workforce Unemployed | 24 | 152 | 189 | |
Civlian Workforce | 559 | 2,413 | 3,190 | |
Military Workforce | 10 | 83 | 93 | |
Total Households | 557 | 2,277 | 2,951 | |
Family Households | 261 | 1,392 | 1,884 | |
Non-Family Households | 296 | 885 | 1,067 | |
Married Couple | 196 | 1,012 | 1,378 | |
Other Family | 66 | 380 | 506 | |
Married w/Child | 90 | 411 | 552 | |
Single Male w/Child | 4 | 67 | 77 | |
Single Female w/Child | 33 | 127 | 164 |
Population Change Last Two Decades - Plus Projection
2000 | % | 2010 | % | 2020 | % | 2030 | |
---|---|---|---|---|---|---|---|
Texas | 20,851,820 | +21 | 25,145,561 | +18 | 29,677,668 | +18 | 34,894,452 |
Coryell County | 74,978 | +1 | 75,388 | +4 | 78,317 | +5 | 82,198 |
Total Working Age Population:
Total Households:
Total Working Age Population:
Total Households:
Total Working Age Population:
Total Households: