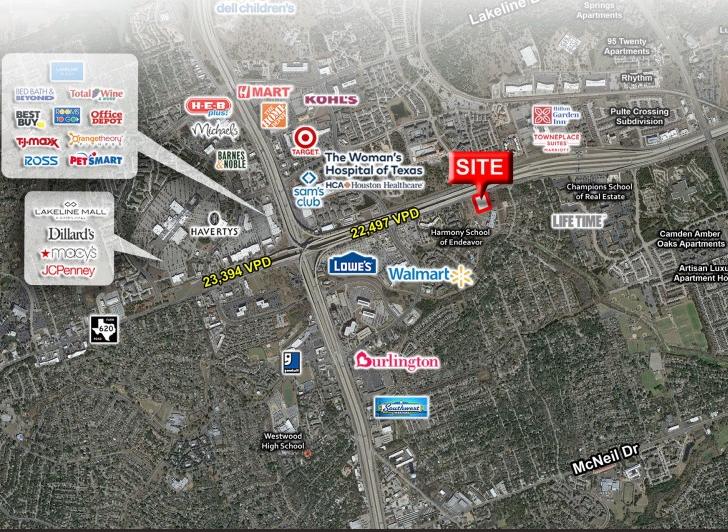
1-Mile | 3-Miles | 5-Miles | ||
---|---|---|---|---|
Total Population | 8,417 | 92,190 | 215,080 | |
Population Median Age | 35 | 36 | 36 | |
Population by Age | 0-9 Yrs | 937 (11%) | 12093 (13%) | 27770 (12%) |
10-19 Yrs | 901 (10%) | 11881 (12%) | 29700 (13%) | |
20-29 Yrs | 1295 (15%) | 12049 (13%) | 26672 (12%) | |
30-39 Yrs | 2162 (25%) | 17265 (18%) | 37291 (17%) | |
40-49 Yrs | 1305 (15%) | 15415 (16%) | 36021 (16%) | |
50-59 Yrs | 856 (10%) | 10525 (11%) | 26625 (12%) | |
60-69 Yrs | 454 (5%) | 6785 (7%) | 16762 (7%) | |
70+ Yrs | 507 (6%) | 6178 (6%) | 14238 (6%) | |
Median HH Income | $68,908 | $90,610 | $100,664 | |
Total Household Income | < 24K | 469 (12%) | 2873 (8%) | 6365 (8%) |
25-49K | 831 (21%) | 5776 (16%) | 11287 (14%) | |
50-74K | 761 (20%) | 6058 (17%) | 12639 (15%) | |
75-99K | 380 (10%) | 3834 (11%) | 9107 (11%) | |
100-199K | 1074 (28%) | 11867 (34%) | 28125 (35%) | |
200K+ | 284 (7%) | 3795 (11%) | 11772 (14%) | |
Highest Education Level | No Diploma | 342 | 2911 | 5248 |
Diploma or GED | 981 | 8447 | 18131 | |
Some College | 1120 | 13242 | 28646 | |
Assoc. Degree | 555 | 4761 | 10971 | |
Bachelors Degree | 2285 | 22198 | 52677 | |
Higher Degree | 966 | 12423 | 32212 | |
Total Housing Units | 4,189 | 37,047 | 84,132 | |
--Owner-Occupied | 873 | 17,785 | 46,512 | |
--Renter-Occupied | 2,925 | 16,419 | 32,782 | |
Owner-Occupied Values | < 100K | 18 | 226 | 679 |
100-199K | 118 | 1291 | 3199 | |
200-299K | 264 | 5301 | 11749 | |
300-399K | 328 | 5665 | 12717 | |
400-499K | 100 | 2799 | 9088 | |
500K+ | 45 | 2503 | 9080 | |
Total Working Age Population | 6,842 | 71,997 | 167,718 | |
In Work Force | 5,651 | 53,241 | 122,314 | |
Not In Work Force | 1,191 | 18,756 | 45,404 | |
Workforce Employed | 5,322 | 50,983 | 116,507 | |
Workforce Unemployed | 330 | 2,237 | 5,722 | |
Civlian Workforce | 5,651 | 53,219 | 122,228 | |
Military Workforce | 0 | 21 | 86 | |
Total Households | 3,798 | 34,204 | 79,294 | |
Family Households | 1,833 | 21,626 | 52,446 | |
Non-Family Households | 1,966 | 12,578 | 26,848 | |
Married Couple | 1,294 | 17,068 | 43,164 | |
Other Family | 539 | 4,558 | 9,282 | |
Married w/Child | 594 | 9,225 | 23,183 | |
Single Male w/Child | 114 | 696 | 1,157 | |
Single Female w/Child | 256 | 1,782 | 3,780 |
Population Change Last Two Decades - Plus Projection
2000 | % | 2010 | % | 2020 | % | 2030 | |
---|---|---|---|---|---|---|---|
Texas | 20,851,820 | +21 | 25,145,561 | +18 | 29,677,668 | +18 | 34,894,452 |
Travis County | 812,280 | +26 | 1,024,266 | +26 | 1,291,502 | +19 | 1,540,812 |
Williamson County | 249,967 | +69 | 422,679 | +40 | 589,914 | +41 | 830,421 |
Total Working Age Population:
Total Households:
Total Working Age Population:
Total Households:
Total Working Age Population:
Total Households: