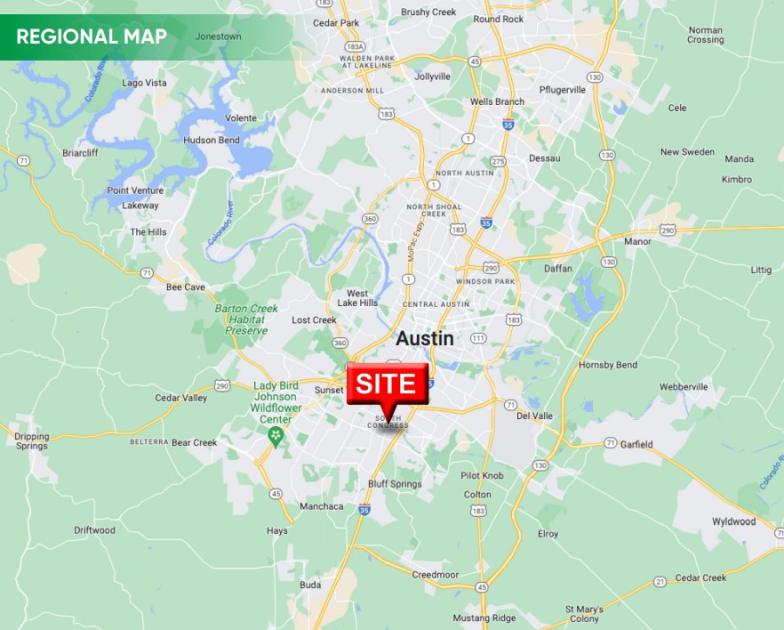
1-Mile | 3-Miles | 5-Miles | ||
---|---|---|---|---|
Total Population | 20,840 | 139,400 | 303,724 | |
Population Median Age | 37 | 35 | 36 | |
Population by Age | 0-9 Yrs | 2158 (10%) | 15210 (10%) | 33116 (10%) |
10-19 Yrs | 1319 (6%) | 13369 (9%) | 26662 (8%) | |
20-29 Yrs | 5210 (25%) | 28776 (20%) | 64727 (21%) | |
30-39 Yrs | 3727 (17%) | 30282 (21%) | 64949 (21%) | |
40-49 Yrs | 2855 (13%) | 18876 (13%) | 41630 (13%) | |
50-59 Yrs | 2527 (12%) | 14298 (10%) | 31256 (10%) | |
60-69 Yrs | 1478 (7%) | 10806 (7%) | 25215 (8%) | |
70+ Yrs | 1566 (7%) | 7782 (5%) | 16168 (5%) | |
Median HH Income | $59,157 | $65,868 | $73,371 | |
Total Household Income | < 24K | 1691 (17%) | 8523 (14%) | 18141 (13%) |
25-49K | 2332 (24%) | 13488 (23%) | 25282 (19%) | |
50-74K | 1902 (19%) | 11575 (19%) | 23911 (18%) | |
75-99K | 1312 (13%) | 8415 (14%) | 18621 (14%) | |
100-199K | 1953 (20%) | 13332 (22%) | 33729 (25%) | |
200K+ | 323 (3%) | 3244 (5%) | 11870 (9%) | |
Highest Education Level | No Diploma | 2038 | 14135 | 23232 |
Diploma or GED | 3423 | 19607 | 35074 | |
Some College | 3256 | 19737 | 41027 | |
Assoc. Degree | 992 | 6134 | 12737 | |
Bachelors Degree | 4405 | 29329 | 73649 | |
Higher Degree | 1462 | 11768 | 35186 | |
Total Housing Units | 9,832 | 62,018 | 141,779 | |
--Owner-Occupied | 2,997 | 23,651 | 54,781 | |
--Renter-Occupied | 6,516 | 34,926 | 76,772 | |
Owner-Occupied Values | < 100K | 101 | 1321 | 2416 |
100-199K | 568 | 4176 | 6630 | |
200-299K | 1262 | 7385 | 16052 | |
300-399K | 731 | 6624 | 13843 | |
400-499K | 264 | 2596 | 6153 | |
500K+ | 72 | 1548 | 9687 | |
Total Working Age Population | 17,755 | 116,078 | 254,689 | |
In Work Force | 13,635 | 89,716 | 198,504 | |
Not In Work Force | 4,120 | 26,362 | 56,185 | |
Workforce Employed | 13,267 | 85,681 | 190,159 | |
Workforce Unemployed | 368 | 4,014 | 8,231 | |
Civlian Workforce | 13,635 | 89,695 | 198,390 | |
Military Workforce | 0 | 21 | 114 | |
Total Households | 9,514 | 58,577 | 131,554 | |
Family Households | 4,483 | 28,818 | 62,637 | |
Non-Family Households | 5,031 | 29,759 | 68,917 | |
Married Couple | 2,961 | 19,051 | 43,479 | |
Other Family | 1,522 | 9,767 | 19,158 | |
Married w/Child | 1,005 | 7,629 | 17,386 | |
Single Male w/Child | 188 | 1,035 | 1,993 | |
Single Female w/Child | 609 | 3,853 | 7,065 |
Population Change Last Two Decades - Plus Projection
2000 | % | 2010 | % | 2020 | % | 2030 | |
---|---|---|---|---|---|---|---|
Texas | 20,851,820 | +21 | 25,145,561 | +18 | 29,677,668 | +18 | 34,894,452 |
Travis County | 812,280 | +26 | 1,024,266 | +26 | 1,291,502 | +19 | 1,540,812 |
Total Working Age Population:
Total Households:
Total Working Age Population:
Total Households:
Total Working Age Population:
Total Households: