Industrial Properties
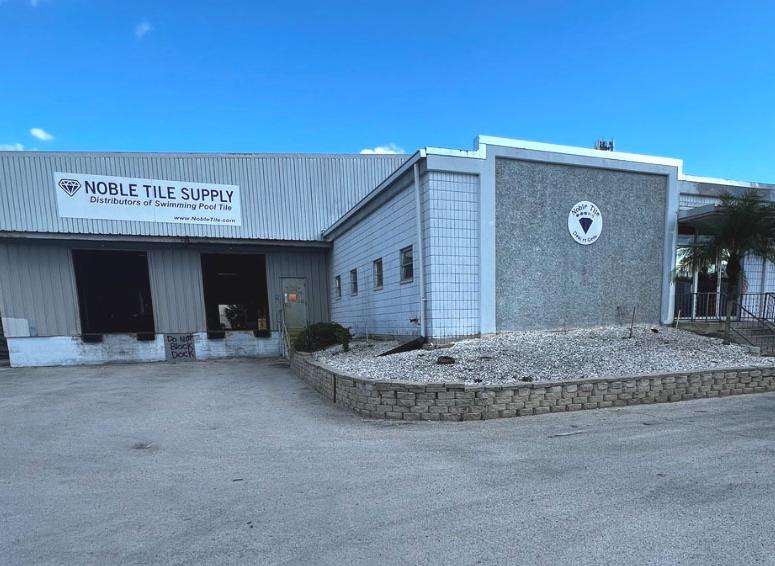
6507 North 54th Street Tampa, FL 33610
6507 North 54th Street Tampa, FL 33610
Details & Description
Property Highlights
- • 22,326 SF Total
- • Outside Storage Space 10,000 SF +/-
- • Zoning - M
- • Pre-engineered Metal Building
Additional Photos


Listing Agents

David Culligan
O: 813-255-4241
M: 813-770-3537
david@cprteam.com
O: 813-255-4241
M: 813-770-3537
david@cprteam.com
While we strive to provide the most accurate information, all listing information, and demographic data, is provided by third-parties. As such, MyEListing will not be responsible for the accuracy of the information. It is strongly recommended that you verify all information with the listing agent, and any relevant agencies, prior to making any decisions.


