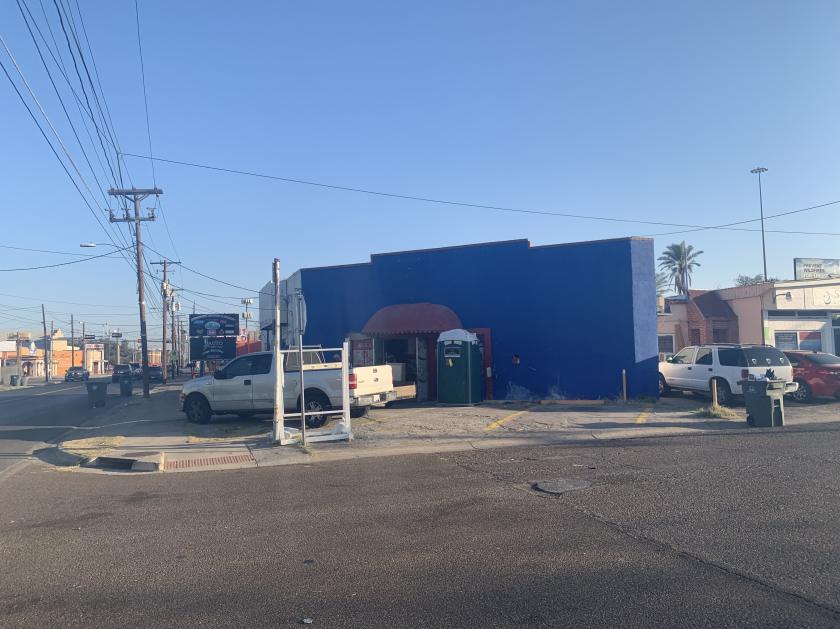
Flex-Office-Warehouse
1801 San Bernardo Avenue Laredo, TX 78040
1801 San Bernardo Avenue Laredo, TX 78040

Details & Description
Property Highlights
- • On-site paved parking
- • Sewer connections
- • corner lot
- • Central AC
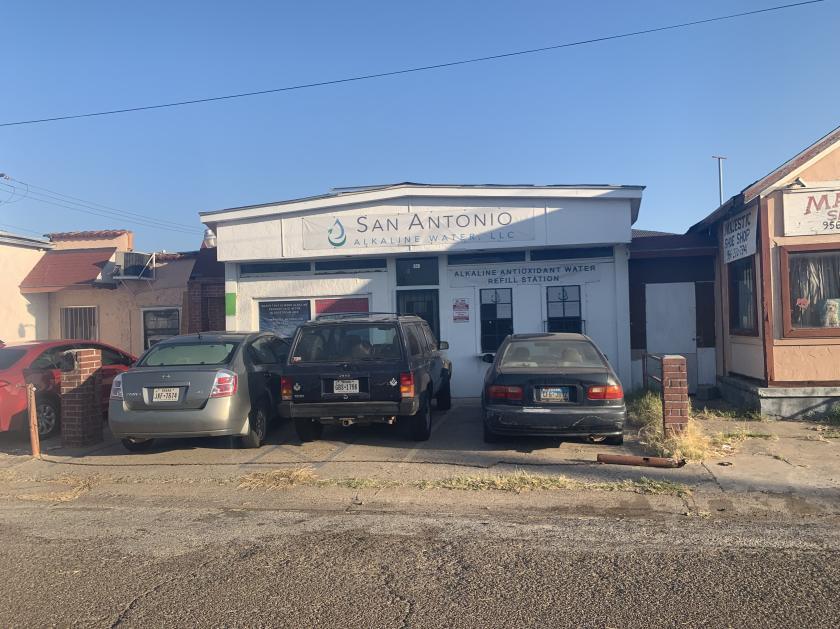
Additional Photos


Listing Agents

Tara Quenga
O: 956-286-4291
M: 956-286-4291
taraquenga@gmail.com
O: 956-286-4291
M: 956-286-4291
taraquenga@gmail.com
While we strive to provide the most accurate information, all listing information, and demographic data, is provided by third-parties. As such, MyEListing will not be responsible for the accuracy of the information. It is strongly recommended that you verify all information with the listing agent, and any relevant agencies, prior to making any decisions.


