Commercial Land
TBD W McGregor Dr McGregor, TX 76657
TBD W McGregor Dr McGregor, TX 76657

Details & Description
Property Highlights
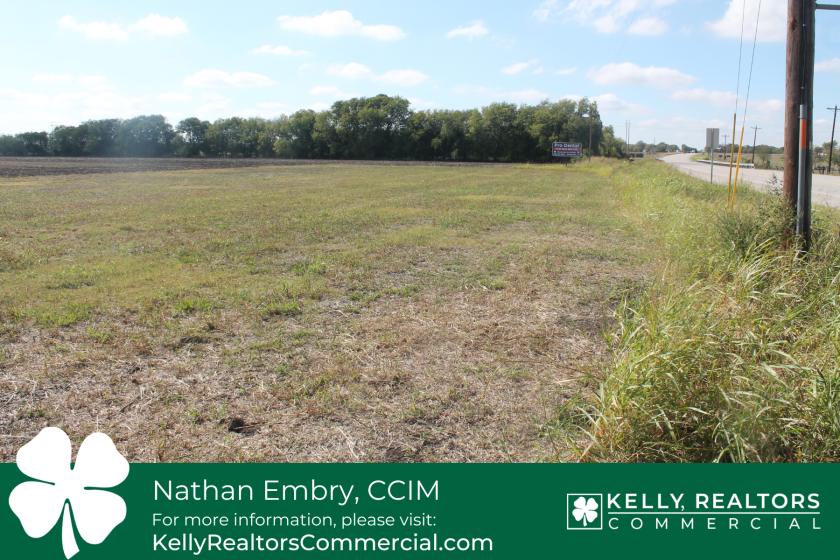
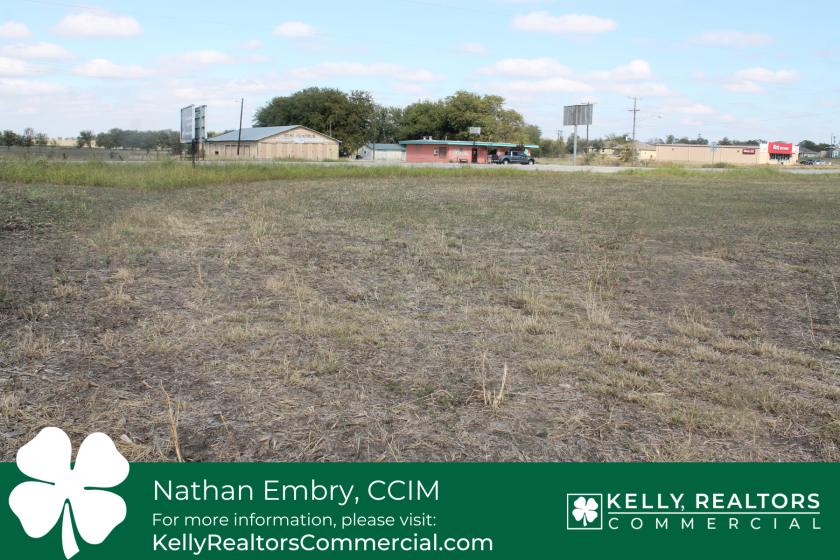
- • Great visibility along major highway
- • Near Downtown McGregor
- • Less than 20 miles to Waco
Additional Photos


Listing Agents

Nathan Embry
O: 254-741-1500
M: 254-855-5500
nathanembryccim@kellyrealtors.com
O: 254-741-1500
M: 254-855-5500
nathanembryccim@kellyrealtors.com
While we strive to provide the most accurate information, all listing information, and demographic data, is provided by third-parties. As such, MyEListing will not be responsible for the accuracy of the information. It is strongly recommended that you verify all information with the listing agent, and any relevant agencies, prior to making any decisions.


