Industrial Properties
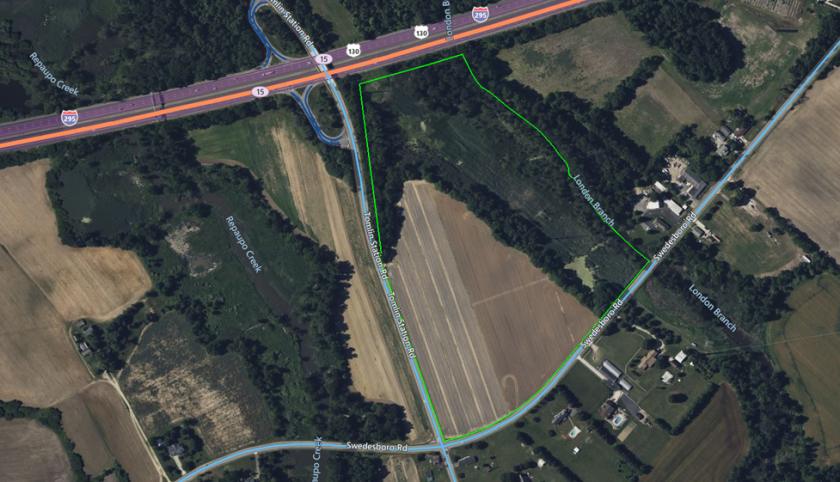
625 Swedesboro Rd Greenwich Township, NJ 08027
625 Swedesboro Rd Greenwich Township, NJ 08027
Details & Description
Property Highlights
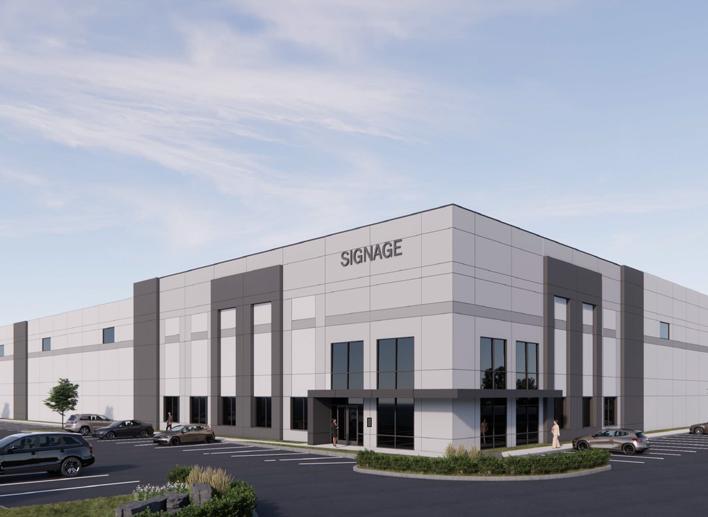
• ±204,120 SF Industrial Warehouse Opportunity
• ±204,120 SF Industrial Warehouse Opportunity
Listing Agents

Juan Disla
O: 973-379-6644
jd@blauberg.com
O: 973-379-6644
jd@blauberg.com
While we strive to provide the most accurate information, all listing information, and demographic data, is provided by third-parties. As such, MyEListing will not be responsible for the accuracy of the information. It is strongly recommended that you verify all information with the listing agent, and any relevant agencies, prior to making any decisions.