Office Space
446 West 55th Street New York, NY 10019
446 West 55th Street New York, NY 10019

Details & Description
Property Highlights
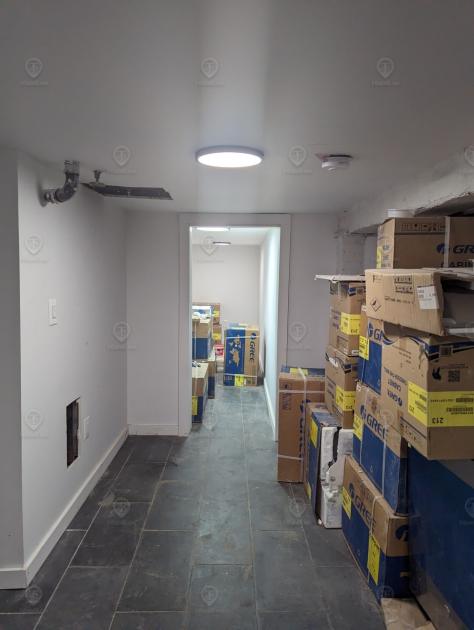
- • Clean and dry garden-level space
- • Direct street access
- • Perfect for a storage or quiet private office user
Additional Photos


Listing Agents

Shlomi Bagdadi
O: 718-437-6100
info@tristatecr.com
O: 718-437-6100
info@tristatecr.com
While we strive to provide the most accurate information, all listing information, and demographic data, is provided by third-parties. As such, MyEListing will not be responsible for the accuracy of the information. It is strongly recommended that you verify all information with the listing agent, and any relevant agencies, prior to making any decisions.


