Retail Space
132-10 Cross Bay Boulevard Queens, NY 11417
132-10 Cross Bay Boulevard Queens, NY 11417

Details & Description
Property Highlights
- • Great visibility
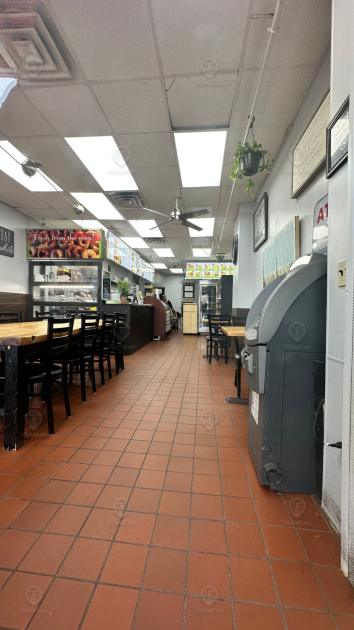
- • Turn key
- • Vented + gas
- • Currently built out as a deli/bagel shop
- • 1,200 SF basement
- • Backyard access
Listing Agents

Shlomi Bagdadi
O: 718-437-6100
info@tristatecr.com
O: 718-437-6100
info@tristatecr.com
While we strive to provide the most accurate information, all listing information, and demographic data, is provided by third-parties. As such, MyEListing will not be responsible for the accuracy of the information. It is strongly recommended that you verify all information with the listing agent, and any relevant agencies, prior to making any decisions.