Multifamily Housing
1997 Pacific Street Brooklyn, NY 11234
1997 Pacific Street Brooklyn, NY 11234

Details & Description
Property Highlights
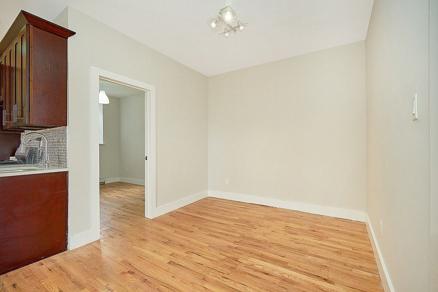
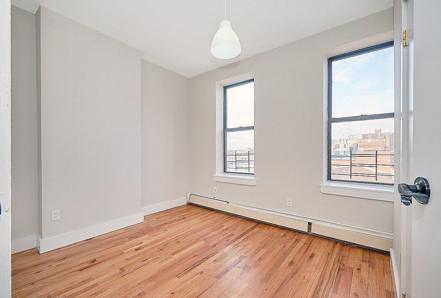
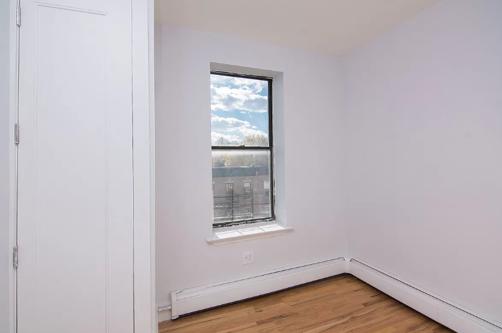
• Corner mixed-use building consisting of 7 Apartments and 2 Stores for Sale in Crown Heights neighborhood of Brooklyn.
• Property is also located near Utica Avenue [A,C] Train Station.
Additional Photos


Listing Agents

Sadya Liberow
O: 646-363-6175
M: 347-762-4055
sadya@assetcrg.com
O: 646-363-6175
M: 347-762-4055
sadya@assetcrg.com
While we strive to provide the most accurate information, all listing information, and demographic data, is provided by third-parties. As such, MyEListing will not be responsible for the accuracy of the information. It is strongly recommended that you verify all information with the listing agent, and any relevant agencies, prior to making any decisions.