Industrial Properties
Eubanks Rd and US 64 Bus Pittsboro, NC 27312
Eubanks Rd and US 64 Bus Pittsboro, NC 27312
Details & Description
Property Highlights
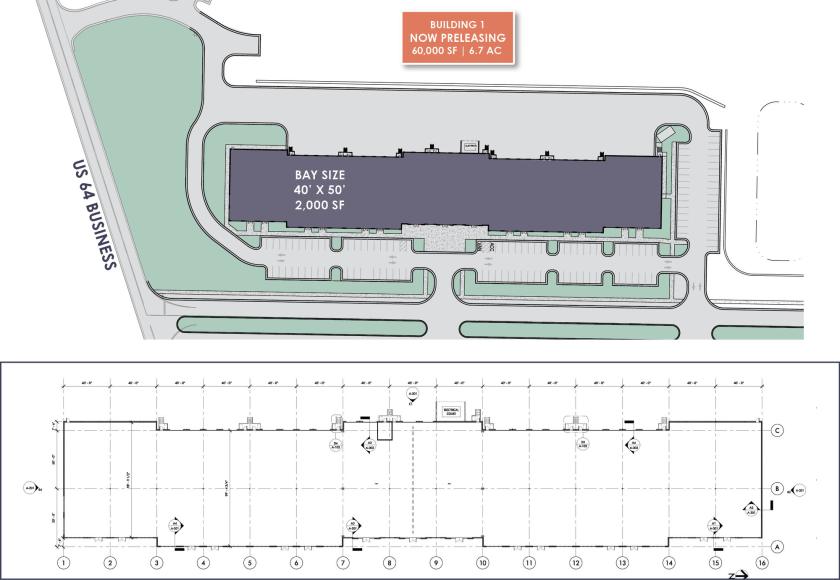
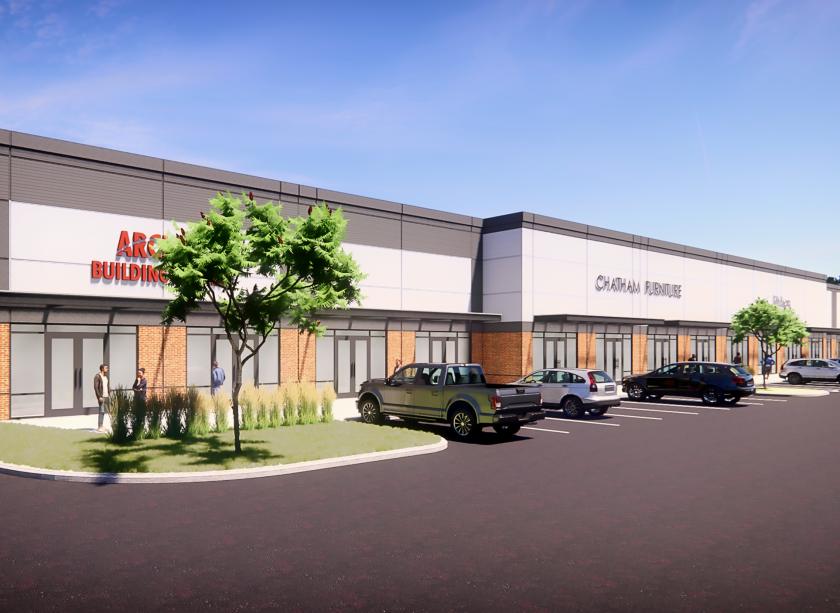
- • 60,000 SF Flex/Industrial
- • Delivering Q3 2023
- • Two dock doors per bay
- • Bay size: 40’ x 50’ (2,000 SF)
- • 125 Parking spaces
- • Option to add a ramp
Listing Agents

Ryan Lawler
O: 919-576-2511
M: 949-291-3896
rlawler@lee-associates.com
O: 919-576-2511
M: 949-291-3896
rlawler@lee-associates.com

Aldene Creech Osborne
O: 919-576-2500
M: 919-622-7272
dcreech@lee-associates.com
O: 919-576-2500
M: 919-622-7272
dcreech@lee-associates.com
While we strive to provide the most accurate information, all listing information, and demographic data, is provided by third-parties. As such, MyEListing will not be responsible for the accuracy of the information. It is strongly recommended that you verify all information with the listing agent, and any relevant agencies, prior to making any decisions.