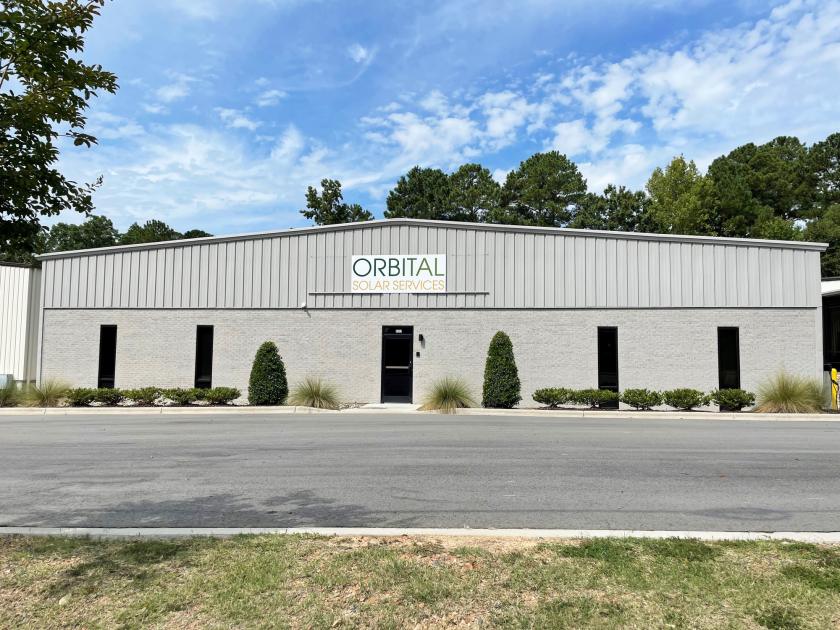
Flex-Office-Warehouse
5313 - 5319 Womack Rd Sanford, NC 27330
5313 - 5319 Womack Rd Sanford, NC 27330

Details & Description
Property Highlights
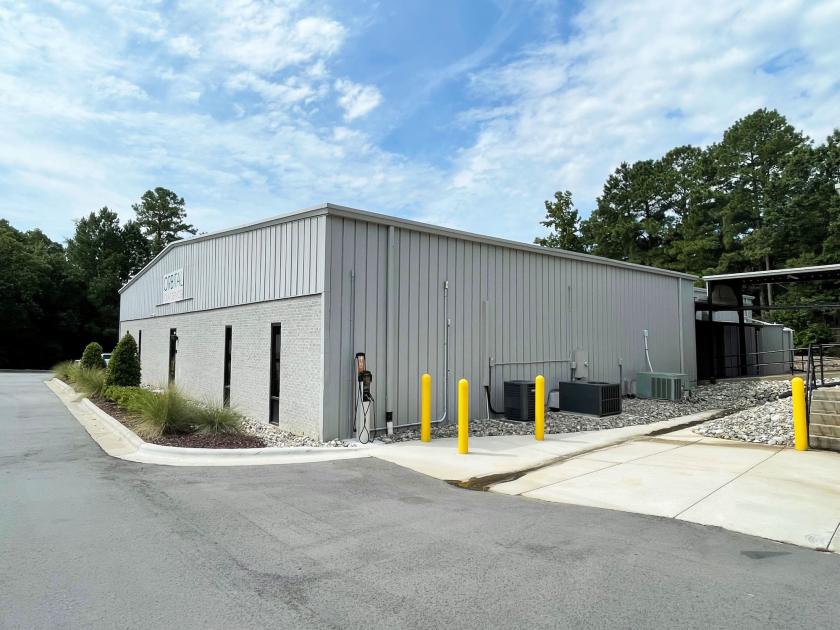
- • Building 3 - 9,412 SF
- • Recently paved parking lot and updated landscaping
- • Fully conditioned with built out office space
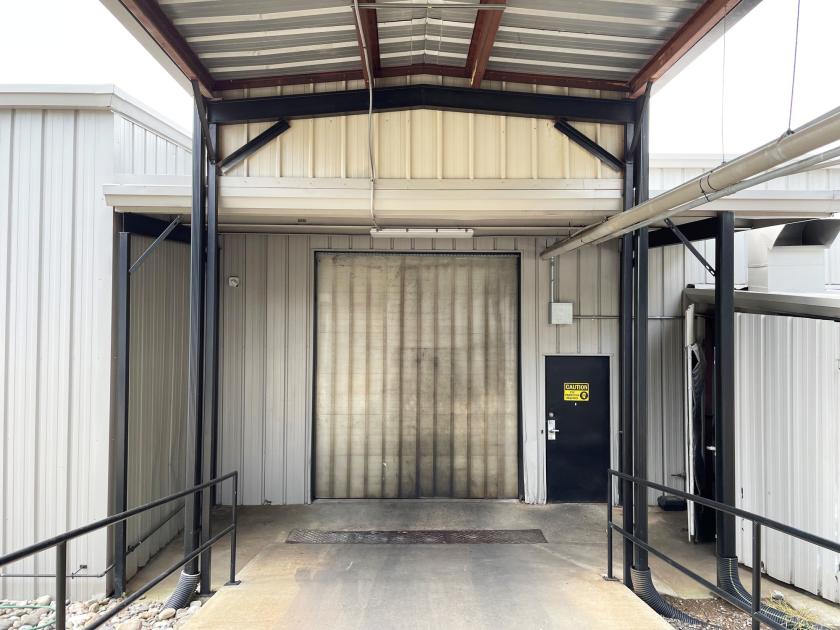
- • Dock doors
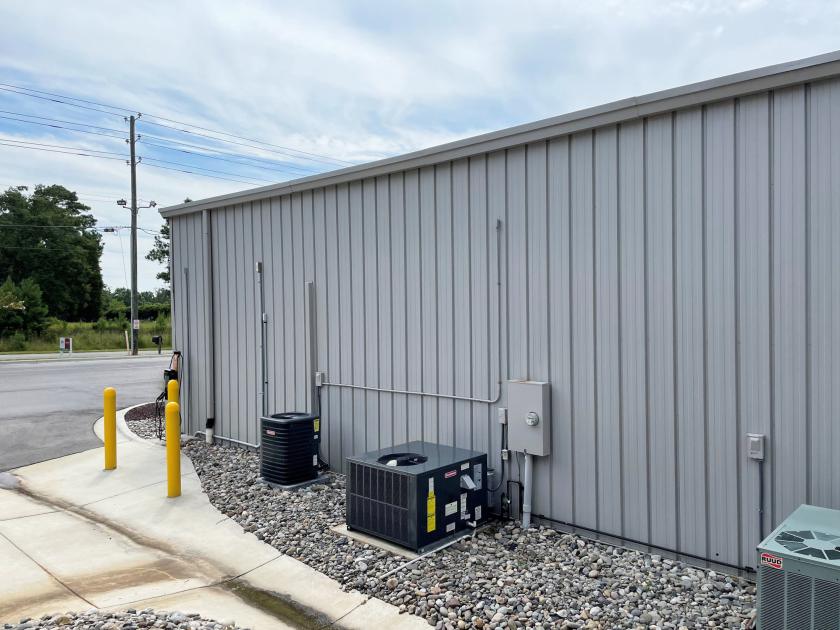
- • 3-Phase power
- • New HVAC
Additional Photos


Listing Agents

Russell Stewart
O: 919-576-2506
M: 919-909-9779
rstewart@lee-associates.com
O: 919-576-2506
M: 919-909-9779
rstewart@lee-associates.com

Hunter Stewart
O: 919-576-2507
M: 919-548-3172
hstewart@lee-associates.com
O: 919-576-2507
M: 919-548-3172
hstewart@lee-associates.com
While we strive to provide the most accurate information, all listing information, and demographic data, is provided by third-parties. As such, MyEListing will not be responsible for the accuracy of the information. It is strongly recommended that you verify all information with the listing agent, and any relevant agencies, prior to making any decisions.