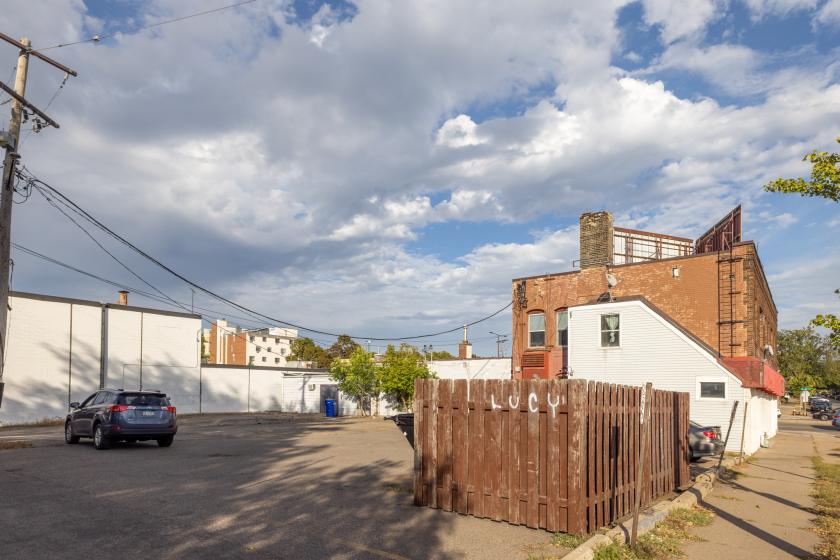
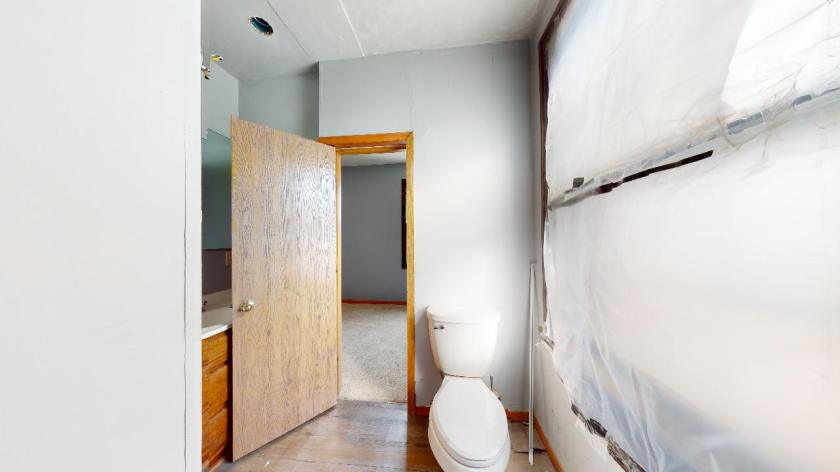
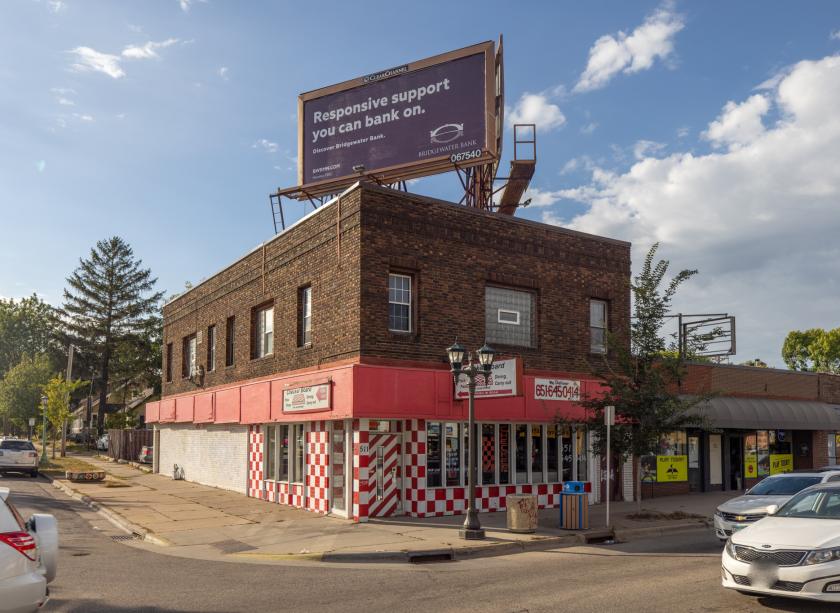
1-Mile | 3-Miles | 5-Miles | ||
---|---|---|---|---|
Total Population | 21,137 | 168,157 | 428,965 | |
Population Median Age | 35 | 37 | 36 | |
Population by Age | 0-9 Yrs | 2123 (10%) | 18335 (10%) | 50800 (11%) |
10-19 Yrs | 2905 (13%) | 20833 (12%) | 56736 (13%) | |
20-29 Yrs | 5197 (24%) | 32776 (19%) | 86825 (20%) | |
30-39 Yrs | 3194 (15%) | 27141 (16%) | 68796 (16%) | |
40-49 Yrs | 2105 (9%) | 18208 (10%) | 45562 (10%) | |
50-59 Yrs | 2366 (11%) | 20206 (12%) | 47457 (11%) | |
60-69 Yrs | 1842 (8%) | 17653 (10%) | 40576 (9%) | |
70+ Yrs | 1405 (6%) | 13003 (7%) | 32213 (7%) | |
Median HH Income | $61,543 | $68,908 | $62,745 | |
Total Household Income | < 24K | 1903 (22%) | 11825 (17%) | 35467 (20%) |
25-49K | 1695 (19%) | 13145 (19%) | 34552 (20%) | |
50-74K | 1494 (17%) | 12232 (17%) | 29785 (17%) | |
75-99K | 1043 (12%) | 8476 (12%) | 20576 (12%) | |
100-199K | 1928 (22%) | 16697 (24%) | 38205 (22%) | |
200K+ | 431 (5%) | 6424 (9%) | 12780 (7%) | |
Highest Education Level | No Diploma | 791 | 7030 | 28031 |
Diploma or GED | 2265 | 16743 | 46954 | |
Some College | 1790 | 16594 | 45128 | |
Assoc. Degree | 1008 | 7692 | 20363 | |
Bachelors Degree | 4188 | 34355 | 79443 | |
Higher Degree | 2996 | 29797 | 56668 | |
Total Housing Units | 9,104 | 73,069 | 181,773 | |
--Owner-Occupied | 4,059 | 39,243 | 85,517 | |
--Renter-Occupied | 4,435 | 29,555 | 85,849 | |
Owner-Occupied Values | < 100K | 94 | 1409 | 4119 |
100-199K | 1261 | 8886 | 21921 | |
200-299K | 1826 | 12796 | 29942 | |
300-399K | 482 | 7970 | 15819 | |
400-499K | 206 | 3836 | 6330 | |
500K+ | 189 | 4347 | 7387 | |
Total Working Age Population | 17,758 | 139,028 | 350,077 | |
In Work Force | 13,121 | 98,971 | 244,850 | |
Not In Work Force | 4,636 | 40,057 | 105,227 | |
Workforce Employed | 12,389 | 94,831 | 231,859 | |
Workforce Unemployed | 721 | 4,076 | 12,848 | |
Civlian Workforce | 13,110 | 98,907 | 244,707 | |
Military Workforce | 11 | 64 | 143 | |
Total Households | 8,494 | 68,798 | 171,366 | |
Family Households | 3,682 | 34,825 | 83,855 | |
Non-Family Households | 4,812 | 33,974 | 87,511 | |
Married Couple | 2,756 | 26,775 | 60,030 | |
Other Family | 926 | 8,050 | 23,825 | |
Married w/Child | 1,302 | 11,277 | 25,003 | |
Single Male w/Child | 108 | 1,194 | 3,099 | |
Single Female w/Child | 507 | 3,463 | 10,806 |
Population Change Last Two Decades - Plus Projection
2000 | % | 2010 | % | 2020 | % | 2030 | |
---|---|---|---|---|---|---|---|
Minnesota | 4,919,479 | +8 | 5,303,925 | +7 | 5,687,161 | +5 | 5,974,304 |
Dakota County | 355,904 | +12 | 398,552 | +9 | 434,203 | +7 | 463,564 |
Hennepin County | 1,116,200 | +3 | 1,152,425 | +12 | 1,294,371 | +9 | 1,407,332 |
Ramsey County | 511,035 | 0 | 508,640 | +12 | 567,959 | +9 | 616,408 |
Total Working Age Population:
Total Households:
Total Working Age Population:
Total Households:
Total Working Age Population:
Total Households: