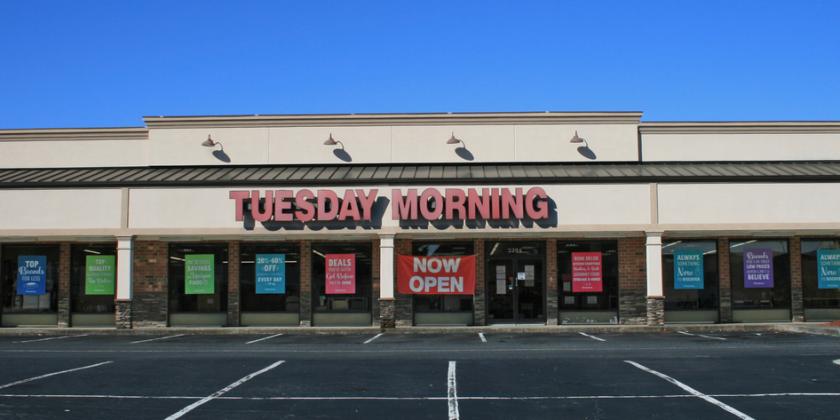
Retail Space
3402 South Church Street Burlington, NC 27215
3402 South Church Street Burlington, NC 27215

Details & Description
Property Highlights
- • Anchored by Badcock Furniture
- • Traffic counts: 19,500 VPD on S. Church Street
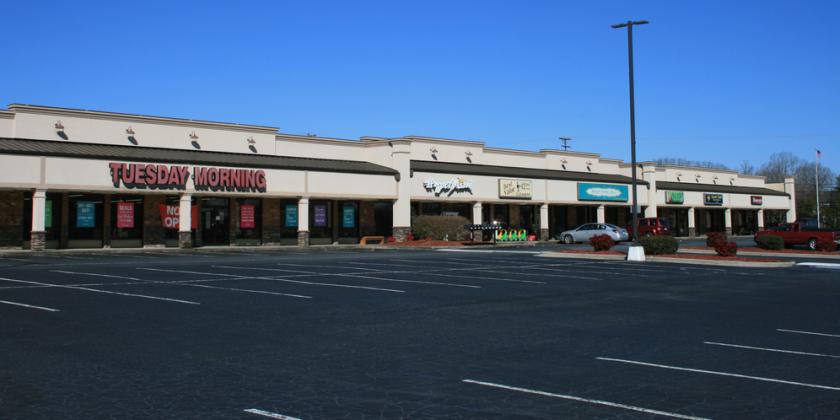
- • Multiple entrances on S Church Street
- • Large parking field
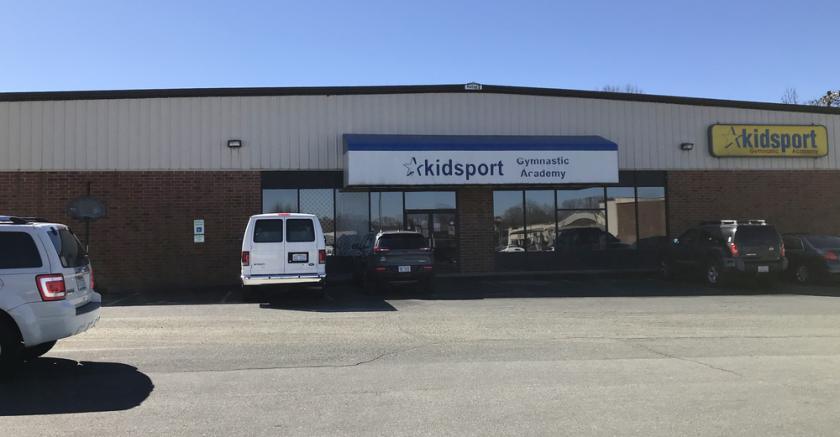
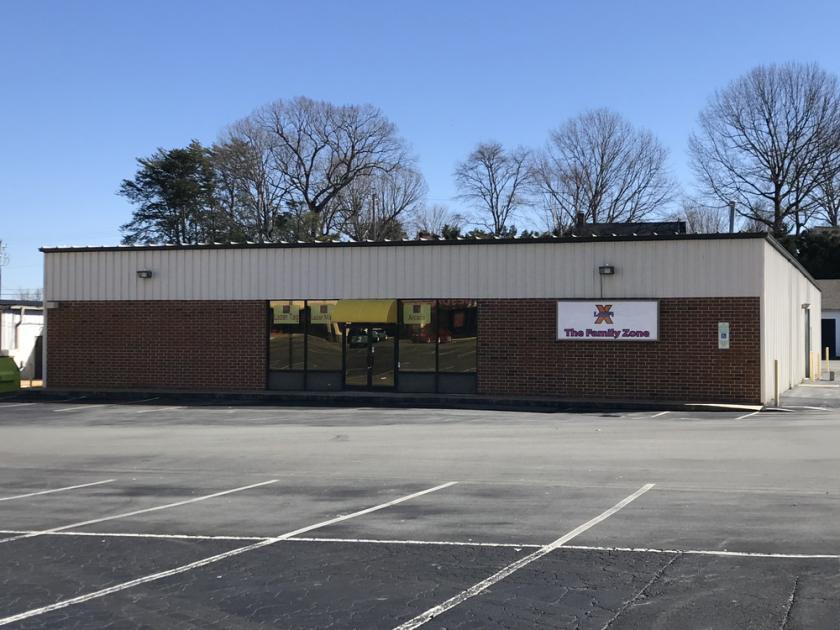
Additional Photos

Listing Agents

Jenn Olevitch-Roberson
O: 919-576-2517
M: 919-345-1752
jolevitch-roberson@lee-associates.com
O: 919-576-2517
M: 919-345-1752
jolevitch-roberson@lee-associates.com
While we strive to provide the most accurate information, all listing information, and demographic data, is provided by third-parties. As such, MyEListing will not be responsible for the accuracy of the information. It is strongly recommended that you verify all information with the listing agent, and any relevant agencies, prior to making any decisions.