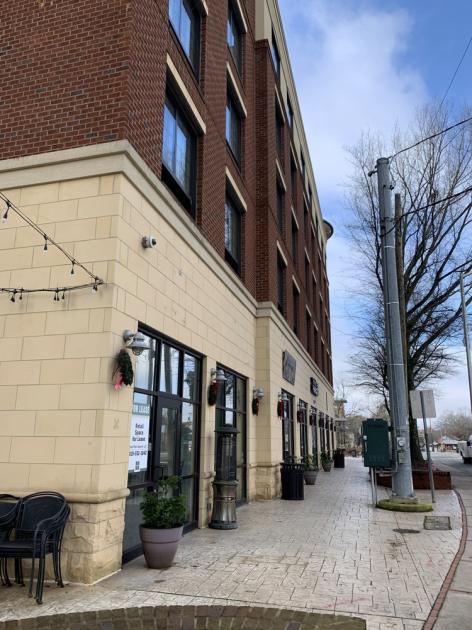
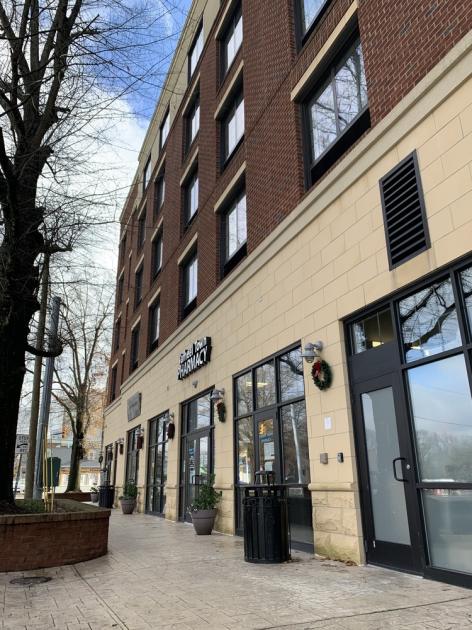
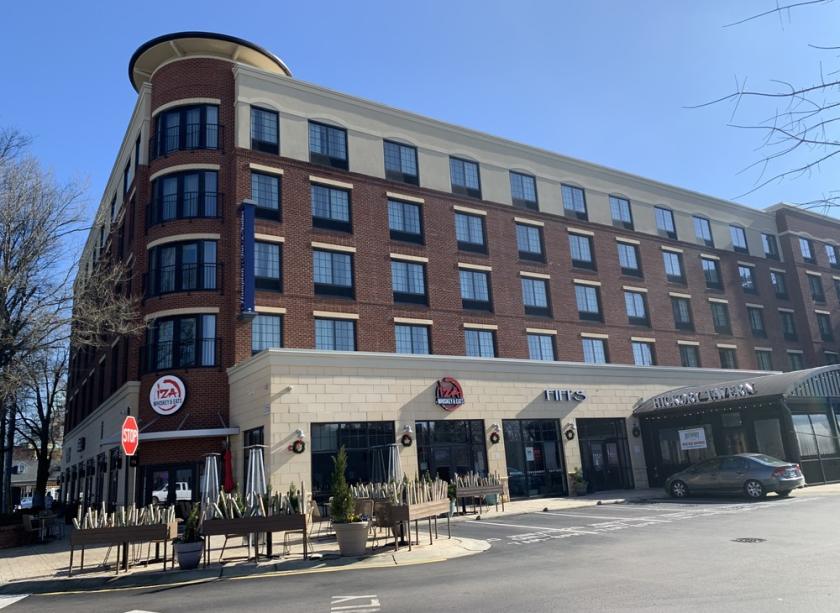
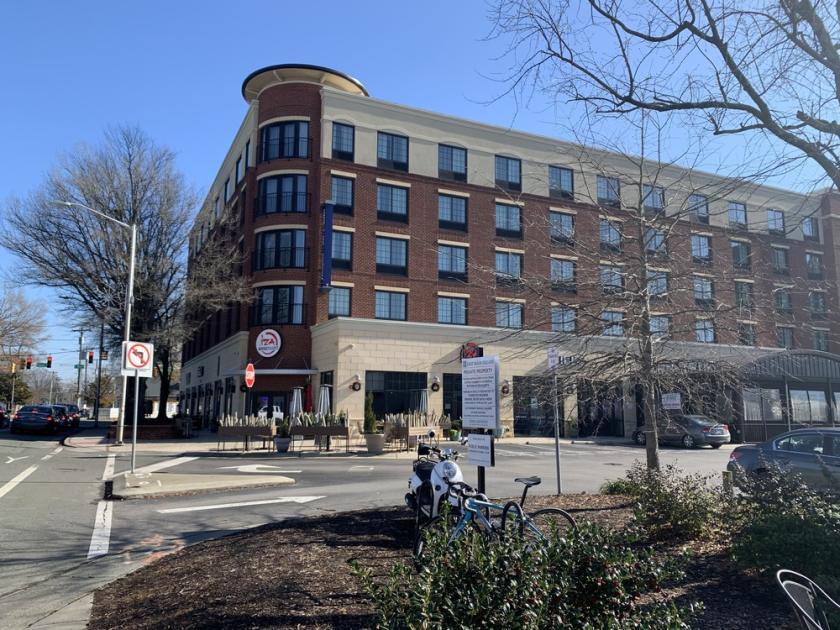
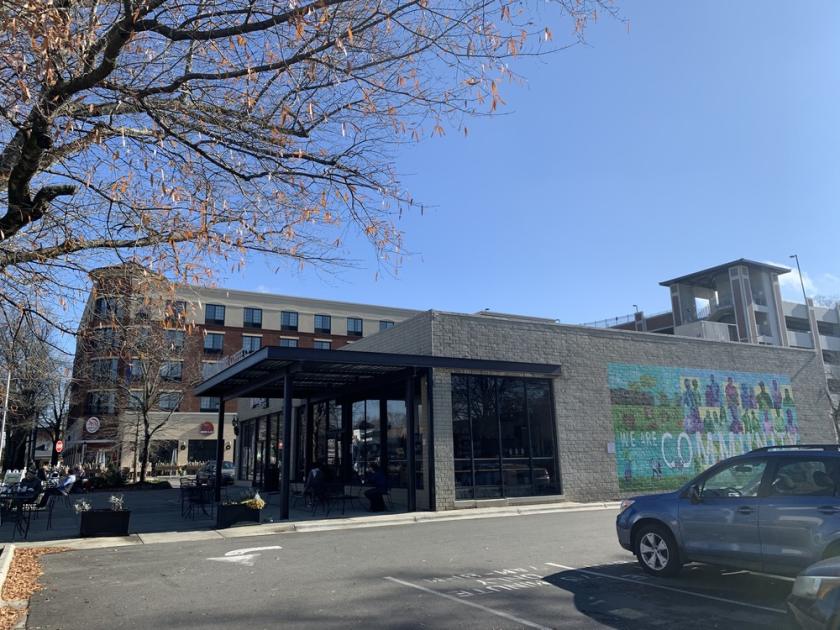
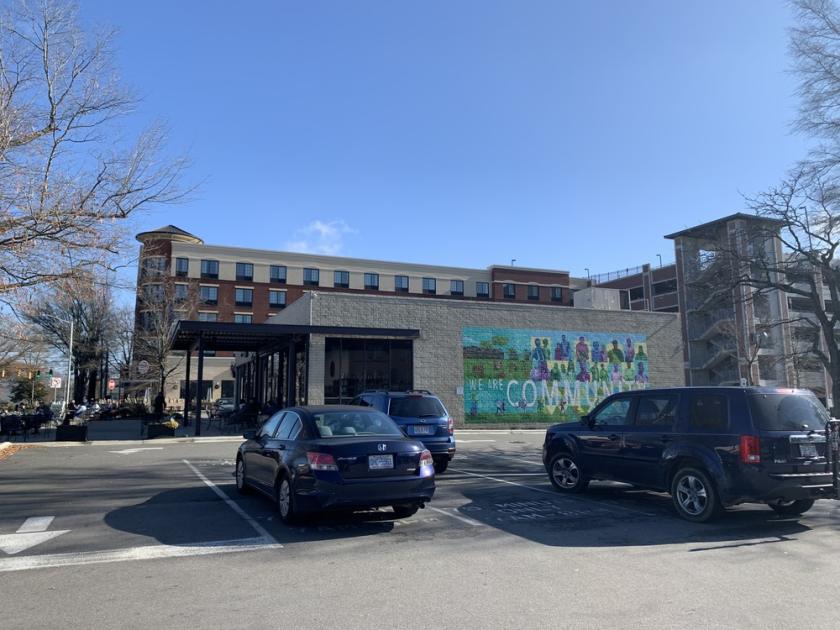
1-Mile | 3-Miles | 5-Miles | ||
---|---|---|---|---|
Total Population | 18,609 | 61,458 | 101,211 | |
Population Median Age | 31 | 33 | 36 | |
Population by Age | 0-9 Yrs | 771 (4%) | 4529 (7%) | 9090 (8%) |
10-19 Yrs | 2695 (14%) | 11441 (18%) | 16766 (16%) | |
20-29 Yrs | 9106 (48%) | 19910 (32%) | 24117 (23%) | |
30-39 Yrs | 2258 (12%) | 6767 (11%) | 11254 (11%) | |
40-49 Yrs | 761 (4%) | 5346 (8%) | 11003 (10%) | |
50-59 Yrs | 917 (4%) | 5204 (8%) | 10570 (10%) | |
60-69 Yrs | 1068 (5%) | 4672 (7%) | 9083 (8%) | |
70+ Yrs | 1033 (5%) | 3589 (5%) | 9329 (9%) | |
Median HH Income | $48,282 | $61,537 | $78,024 | |
Total Household Income | < 24K | 1740 (28%) | 4479 (22%) | 6624 (18%) |
25-49K | 1373 (22%) | 3706 (18%) | 5961 (16%) | |
50-74K | 1076 (17%) | 3228 (15%) | 5266 (14%) | |
75-99K | 868 (14%) | 1960 (9%) | 3957 (10%) | |
100-199K | 563 (9%) | 3553 (17%) | 7976 (21%) | |
200K+ | 427 (7%) | 3325 (16%) | 6875 (18%) | |
Highest Education Level | No Diploma | 592 | 1509 | 2625 |
Diploma or GED | 743 | 2176 | 4406 | |
Some College | 1394 | 3759 | 6141 | |
Assoc. Degree | 391 | 1325 | 2514 | |
Bachelors Degree | 2724 | 8798 | 16278 | |
Higher Degree | 2453 | 13870 | 27203 | |
Total Housing Units | 6,949 | 22,928 | 40,431 | |
--Owner-Occupied | 1,528 | 8,968 | 20,376 | |
--Renter-Occupied | 4,521 | 11,283 | 16,284 | |
Owner-Occupied Values | < 100K | 47 | 256 | 655 |
100-199K | 287 | 887 | 2036 | |
200-299K | 260 | 1139 | 2984 | |
300-399K | 319 | 1845 | 4333 | |
400-499K | 286 | 1563 | 3604 | |
500K+ | 328 | 3278 | 6764 | |
Total Working Age Population | 17,178 | 53,365 | 84,999 | |
In Work Force | 10,520 | 32,714 | 52,444 | |
Not In Work Force | 6,658 | 20,651 | 32,556 | |
Workforce Employed | 9,761 | 31,238 | 50,116 | |
Workforce Unemployed | 759 | 1,466 | 2,318 | |
Civlian Workforce | 10,519 | 32,704 | 52,434 | |
Military Workforce | 1 | 10 | 10 | |
Total Households | 6,048 | 20,251 | 36,660 | |
Family Households | 2,291 | 10,338 | 20,806 | |
Non-Family Households | 3,757 | 9,914 | 15,854 | |
Married Couple | 1,609 | 8,044 | 16,907 | |
Other Family | 683 | 2,294 | 3,899 | |
Married w/Child | 598 | 3,839 | 7,507 | |
Single Male w/Child | 127 | 322 | 449 | |
Single Female w/Child | 113 | 739 | 1,682 |
Population Change Last Two Decades - Plus Projection
2000 | % | 2010 | % | 2020 | % | 2030 | |
---|---|---|---|---|---|---|---|
North Carolina | 8,049,313 | +18 | 9,535,483 | +11 | 10,630,691 | +11 | 11,836,070 |
Chatham County | 49,329 | +29 | 63,505 | +22 | 77,713 | +22 | 94,920 |
Durham County | 223,314 | +20 | 267,587 | +20 | 320,322 | +14 | 366,111 |
Orange County | 118,227 | +13 | 133,801 | +11 | 148,610 | +10 | 163,699 |
Total Working Age Population:
Total Households:
Total Working Age Population:
Total Households:
Total Working Age Population:
Total Households: