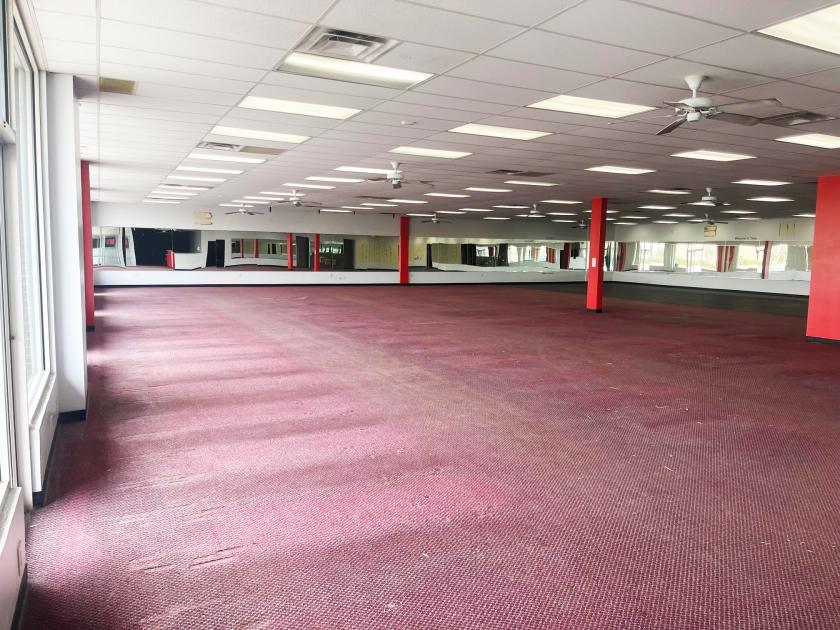
Retail Space
8269 Market Exchange Drive Westerville, OH 43081
8269 Market Exchange Drive Westerville, OH 43081

Details & Description
Property Highlights
- • Former fitness use
- • Open floor plan
- • Available immediately
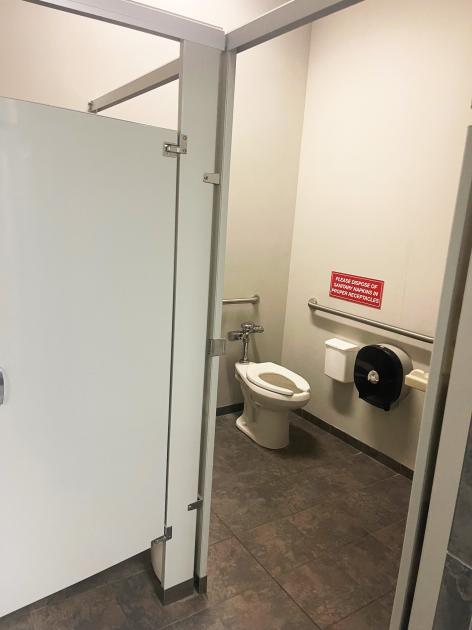
Additional Photos


Listing Agents

Julie Cohen
O: 614-221-4286
M: 614-643-2654
jcohen@rweiler.com
O: 614-221-4286
M: 614-643-2654
jcohen@rweiler.com
While we strive to provide the most accurate information, all listing information, and demographic data, is provided by third-parties. As such, MyEListing will not be responsible for the accuracy of the information. It is strongly recommended that you verify all information with the listing agent, and any relevant agencies, prior to making any decisions.