Flex-Office-Warehouse
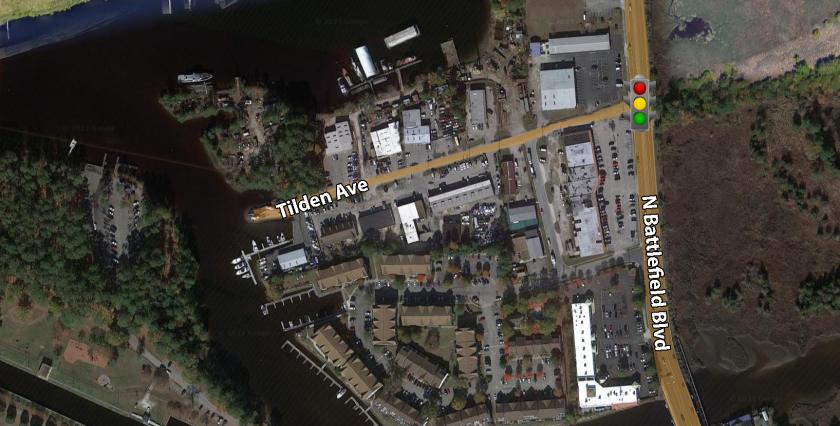
135 Tilden Avenue Chesapeake, VA 23320
135 Tilden Avenue Chesapeake, VA 23320

Details & Description
Listing Agents

Rick Gregor
O: 757-287-3301
rgregor@snugharbordevelopment.com
O: 757-287-3301
rgregor@snugharbordevelopment.com
While we strive to provide the most accurate information, all listing information, and demographic data, is provided by third-parties. As such, MyEListing will not be responsible for the accuracy of the information. It is strongly recommended that you verify all information with the listing agent, and any relevant agencies, prior to making any decisions.