Office Space
80 John Street New York, NY 10038
80 John Street New York, NY 10038
Details & Description
Property Highlights
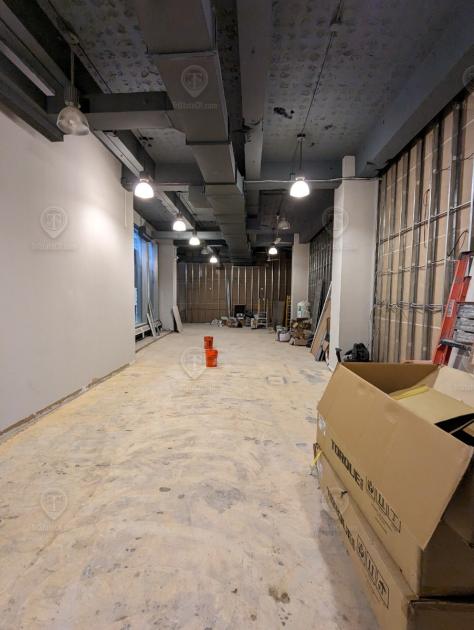
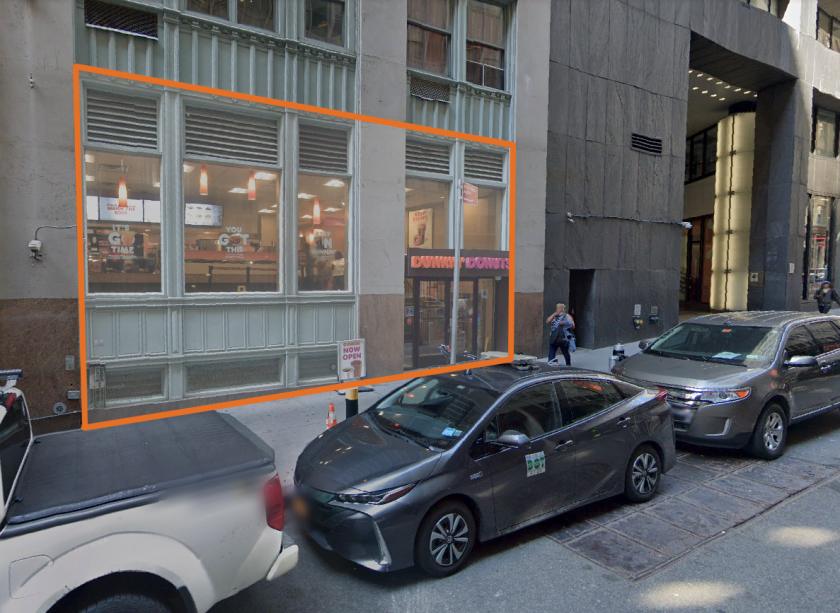
- • Space A - Office (2,500 SF)
- • Shared lobby with Sweat 440
- • Window across entire space facing Gold St
- • Space B: - Retail (1,650 SF)
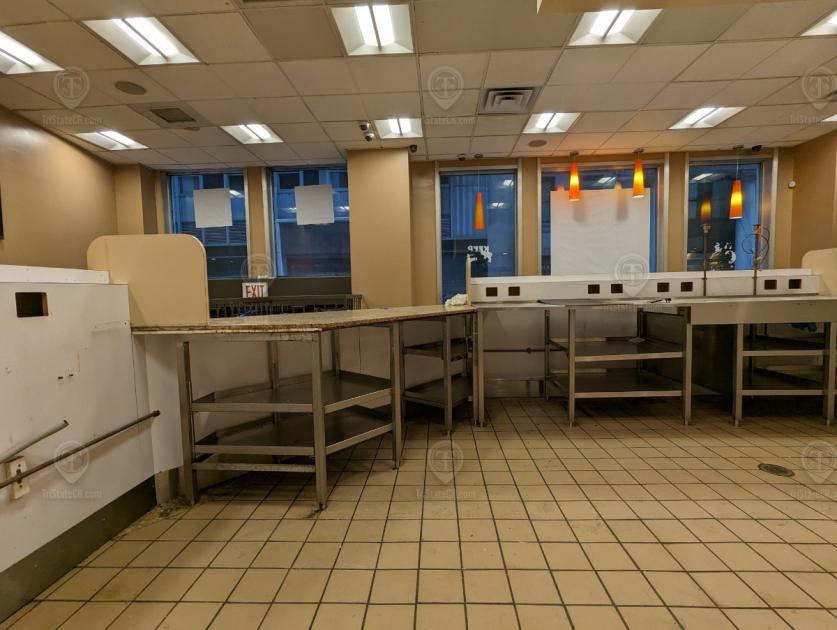
- • Type 1 ventilation
- • Grease trap
Additional Photos


Listing Agents

Shlomi Bagdadi
O: 718-437-6100
info@tristatecr.com
O: 718-437-6100
info@tristatecr.com
While we strive to provide the most accurate information, all listing information, and demographic data, is provided by third-parties. As such, MyEListing will not be responsible for the accuracy of the information. It is strongly recommended that you verify all information with the listing agent, and any relevant agencies, prior to making any decisions.