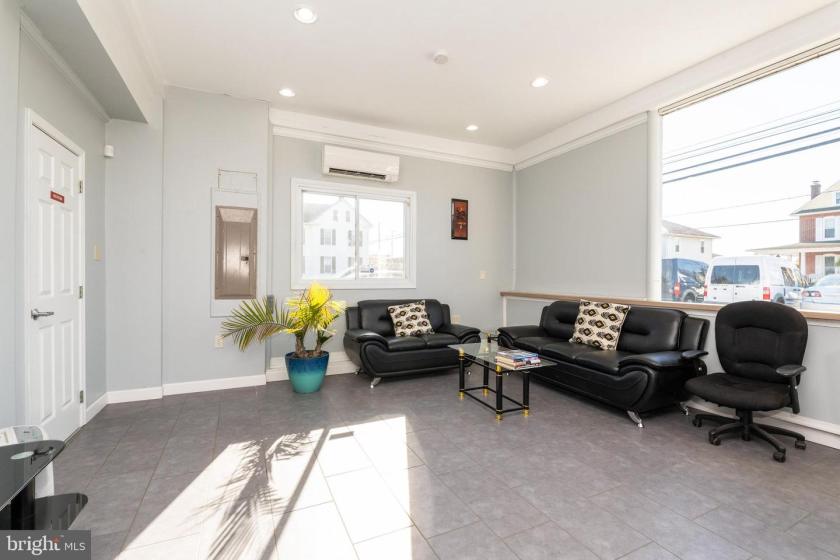
Retail Space
1919 Hanover Pike Hampstead, MD 21074
1919 Hanover Pike Hampstead, MD 21074

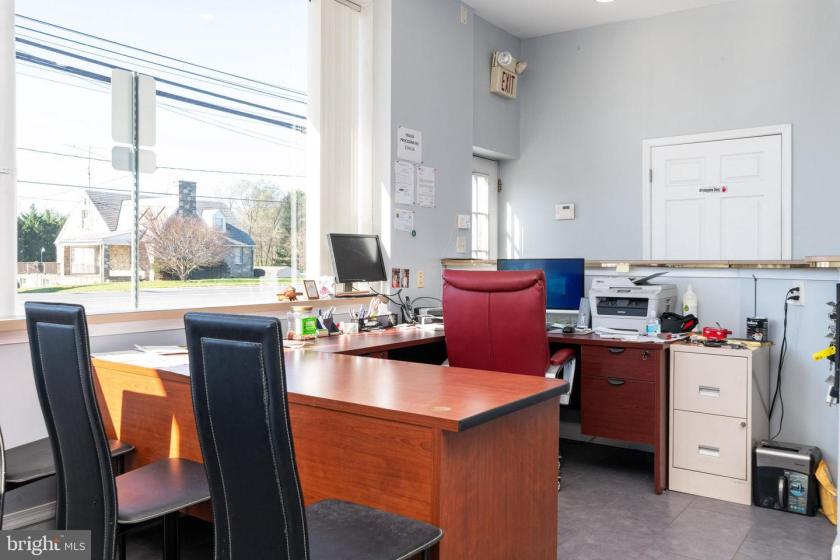
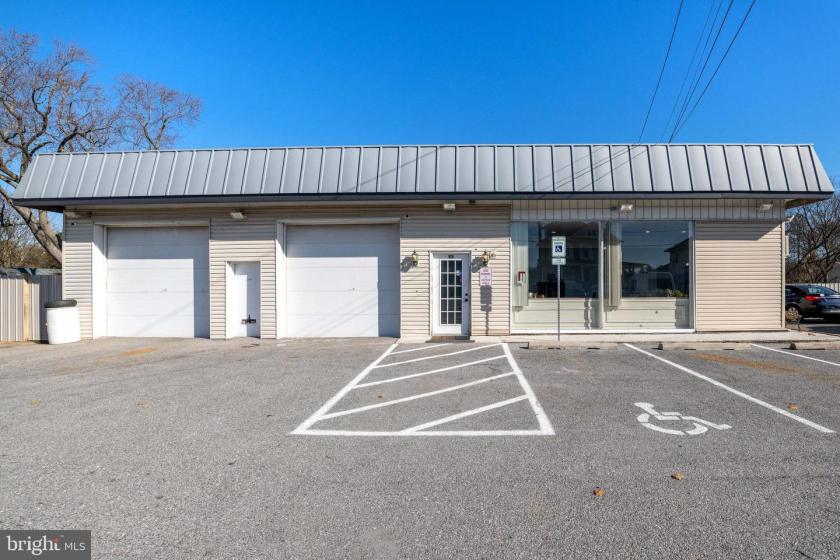
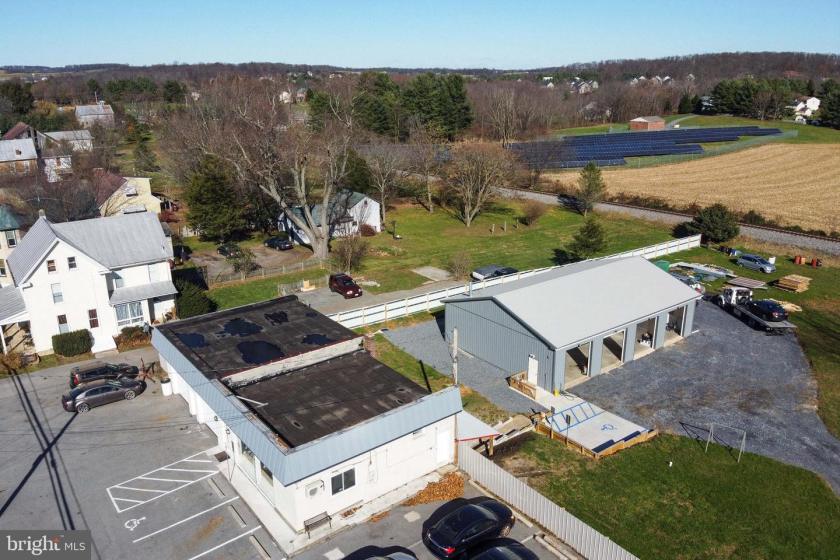
Details & Description
Property Highlights
- • High visibility on main road
- • High traffic road
- • New construction
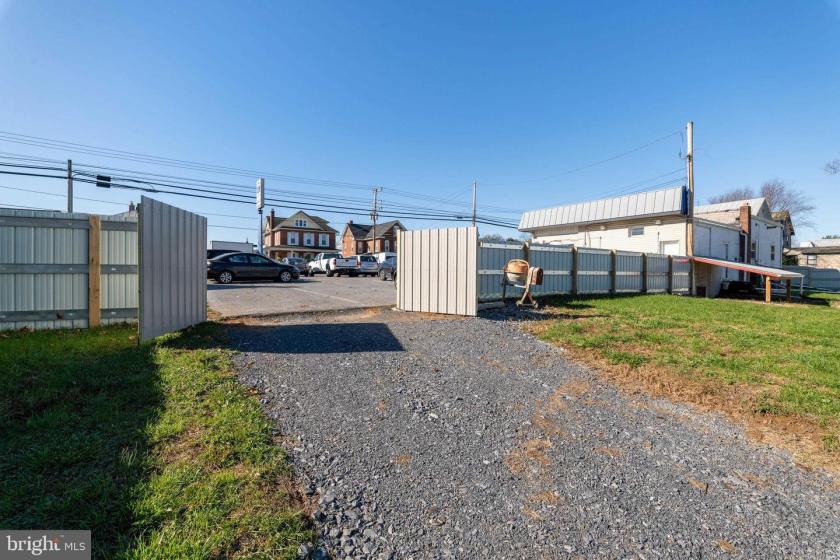
Additional Photos


Listing Agents

Ivaylo Gospodinov
ivog81@yahoo.com
ivog81@yahoo.com
While we strive to provide the most accurate information, all listing information, and demographic data, is provided by third-parties. As such, MyEListing will not be responsible for the accuracy of the information. It is strongly recommended that you verify all information with the listing agent, and any relevant agencies, prior to making any decisions.