Retail Space
712 East Main Street Gatesville, TX 76528
712 East Main Street Gatesville, TX 76528

Details & Description
Property Highlights
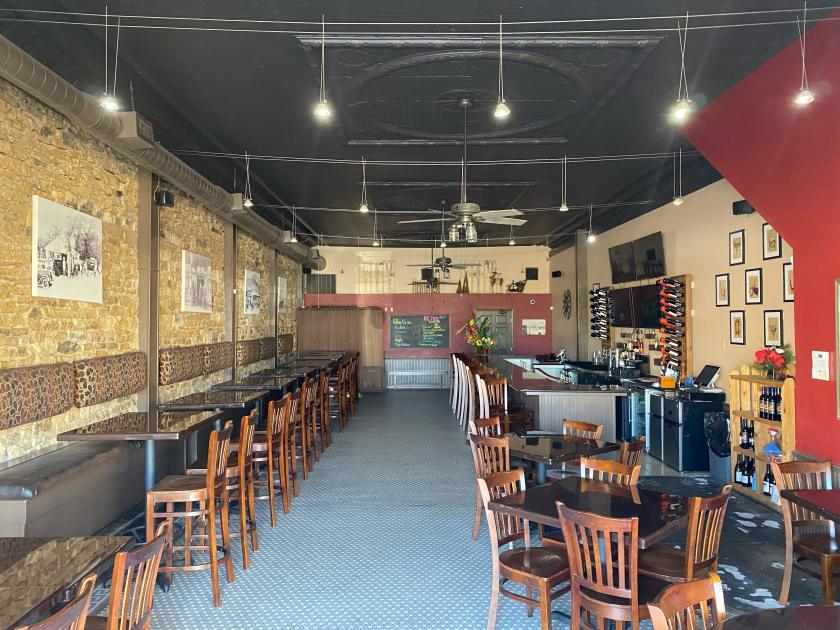
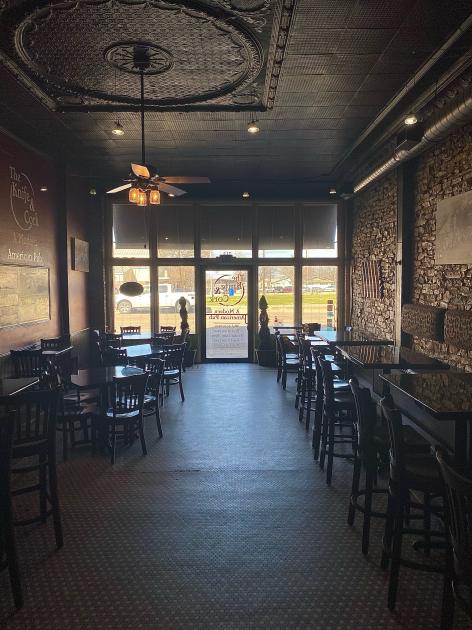
• Restaurant equipment and furniture included in the sale
• Original rock wall, flooring, and ceiling
Additional Photos

Listing Agents

Colt Kelly
O: 254-741-1500
M: 817-991-0182
ckelly@kellyrealtors.com
O: 254-741-1500
M: 817-991-0182
ckelly@kellyrealtors.com
While we strive to provide the most accurate information, all listing information, and demographic data, is provided by third-parties. As such, MyEListing will not be responsible for the accuracy of the information. It is strongly recommended that you verify all information with the listing agent, and any relevant agencies, prior to making any decisions.


