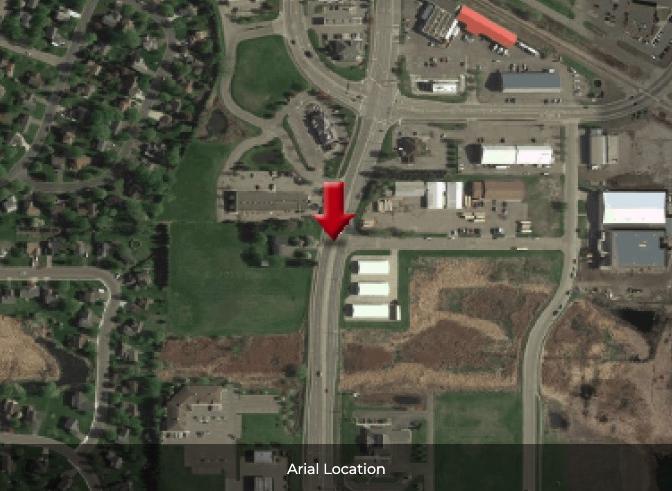
1-Mile | 3-Miles | 5-Miles | ||
---|---|---|---|---|
Total Population | 5,675 | 26,839 | 45,088 | |
Population Median Age | 35 | 32 | 34 | |
Population by Age | 0-9 Yrs | 683 (12%) | 4660 (17%) | 7476 (16%) |
10-19 Yrs | 988 (17%) | 4674 (17%) | 7413 (16%) | |
20-29 Yrs | 798 (14%) | 2996 (11%) | 4899 (10%) | |
30-39 Yrs | 807 (14%) | 4456 (16%) | 7199 (15%) | |
40-49 Yrs | 963 (16%) | 4454 (16%) | 7076 (15%) | |
50-59 Yrs | 651 (11%) | 2878 (10%) | 5348 (11%) | |
60-69 Yrs | 454 (8%) | 1520 (5%) | 3258 (7%) | |
70+ Yrs | 332 (5%) | 1201 (4%) | 2419 (5%) | |
Median HH Income | $74,501 | $104,776 | $104,468 | |
Total Household Income | < 24K | 132 (6%) | 504 (5%) | 790 (5%) |
25-49K | 358 (16%) | 1065 (11%) | 1663 (10%) | |
50-74K | 622 (28%) | 1487 (15%) | 2462 (15%) | |
75-99K | 213 (9%) | 1274 (13%) | 2323 (14%) | |
100-199K | 704 (32%) | 4495 (47%) | 7159 (45%) | |
200K+ | 171 (7%) | 654 (6%) | 1174 (7%) | |
Highest Education Level | No Diploma | 128 | 511 | 1093 |
Diploma or GED | 1006 | 3765 | 6582 | |
Some College | 826 | 3242 | 5239 | |
Assoc. Degree | 336 | 2055 | 3827 | |
Bachelors Degree | 957 | 4897 | 7880 | |
Higher Degree | 361 | 2151 | 3712 | |
Total Housing Units | 2,278 | 9,575 | 15,854 | |
--Owner-Occupied | 1,687 | 7,937 | 13,501 | |
--Renter-Occupied | 513 | 1,543 | 2,070 | |
Owner-Occupied Values | < 100K | 67 | 194 | 349 |
100-199K | 351 | 1540 | 2433 | |
200-299K | 824 | 3364 | 5326 | |
300-399K | 421 | 2101 | 3736 | |
400-499K | 16 | 481 | 953 | |
500K+ | 7 | 257 | 704 | |
Total Working Age Population | 4,211 | 18,895 | 32,472 | |
In Work Force | 3,522 | 15,716 | 25,747 | |
Not In Work Force | 688 | 3,178 | 6,725 | |
Workforce Employed | 3,480 | 15,402 | 25,199 | |
Workforce Unemployed | 42 | 315 | 548 | |
Civlian Workforce | 3,522 | 15,716 | 25,747 | |
Military Workforce | 0 | 0 | 1 | |
Total Households | 2,200 | 9,480 | 15,570 | |
Family Households | 1,635 | 7,361 | 12,143 | |
Non-Family Households | 565 | 2,119 | 3,427 | |
Married Couple | 1,265 | 6,355 | 10,409 | |
Other Family | 371 | 1,006 | 1,734 | |
Married w/Child | 721 | 4,021 | 6,043 | |
Single Male w/Child | 42 | 205 | 292 | |
Single Female w/Child | 115 | 343 | 710 |
Population Change Last Two Decades - Plus Projection
2000 | % | 2010 | % | 2020 | % | 2030 | |
---|---|---|---|---|---|---|---|
Minnesota | 4,919,479 | +8 | 5,303,925 | +7 | 5,687,161 | +5 | 5,974,304 |
Wright County | 89,986 | +39 | 124,700 | +10 | 136,890 | +6 | 145,773 |
Hennepin County | 1,116,200 | +3 | 1,152,425 | +12 | 1,294,371 | +9 | 1,407,332 |
Sherburne County | 64,417 | +37 | 88,499 | +7 | 94,258 | +4 | 98,248 |
Total Working Age Population:
Total Households:
Total Working Age Population:
Total Households:
Total Working Age Population:
Total Households: